. 2005 Feb 15;563(Pt 1):177-91.
doi: 10.1113/jphysiol.2004.074740. Epub 2004 Dec 21.

Increase in efficiency and reduction in Ca2+ dependence of exocytosis during development of mouse inner hair cells

Affiliations

Increase in efficiency and reduction in Ca2+ dependence of exocytosis during development of mouse inner hair cells

Stuart L Johnson et al. J Physiol. .

Abstract

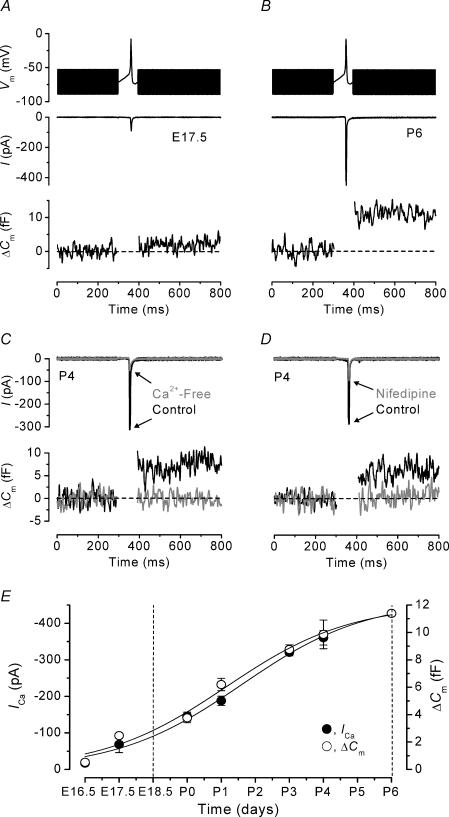
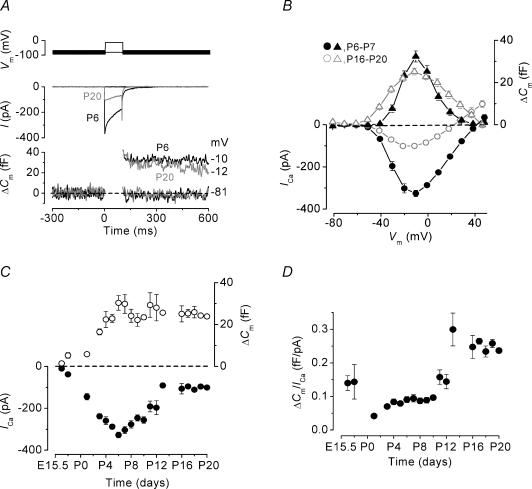
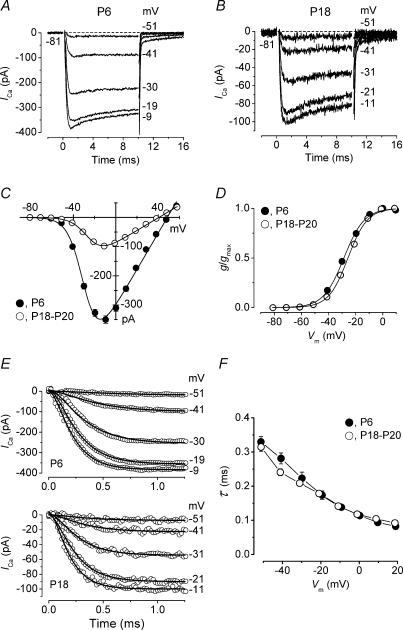
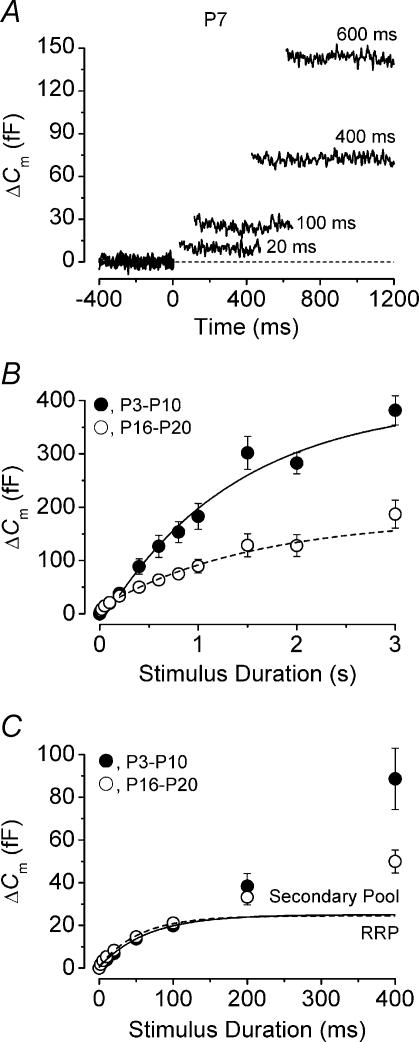
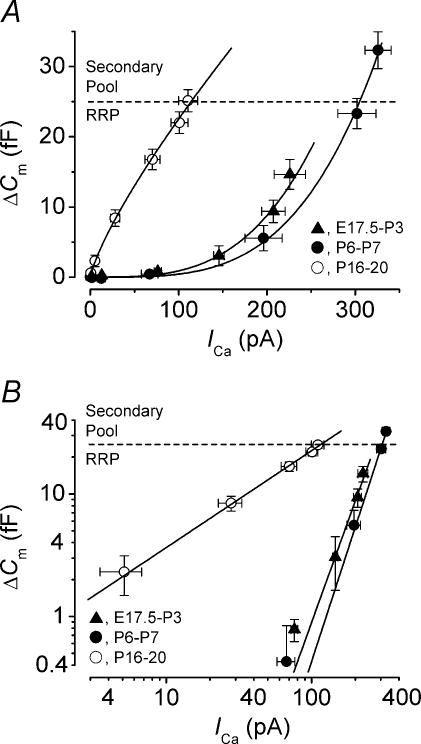
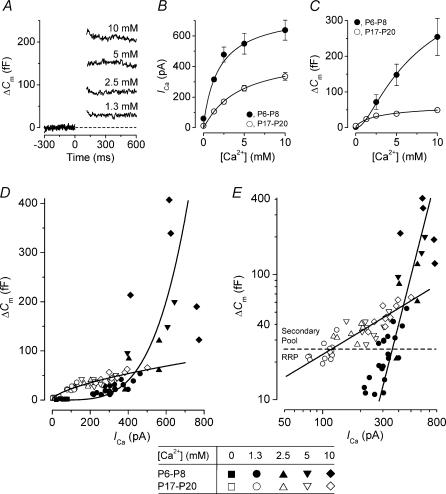
Developmental changes in the coupling between Ca2+ entry and exocytosis were studied in mouse inner hair cells (IHCs) which, together with the afferent endings, form the primary synapse of the mammalian auditory system. Ca2+ currents (ICa) and changes in membrane capacitance (DeltaCm) were recorded using whole-cell voltage clamp from cells maintained at body temperature, using physiological (1.3 mM) extracellular Ca2+. The magnitudes of both ICa and DeltaCm increased with maturation from embryonic stages until postnatal day 6 (P6). Subsequently, ICa gradually declined to a steady level of about -100 pA from P13 while the Ca2+-induced DeltaCm remained relatively constant, indicating a developmental increase in the Ca2+ efficiency of exocytosis. Although the size of ICa changed during development, its activation properties did not, suggesting the presence of a homogeneous population of Ca2+ channels in IHCs throughout development. The Ca2+ dependence of exocytosis changed with maturation from a fourth power relation in immature cells to an approximately linear relation in mature cells. This change applies to the release of both a readily releasable pool (RRP) and a slower secondary pool of vesicles, implying a common release mechanism for these two kinetically distinct pools that becomes modified during development. The increased Ca2+ efficiency and linear Ca2+ dependence of mature IHC exocytosis, especially over the physiological range of intracellular Ca2+, could improve the high-fidelity transmission of both brief and long-lasting stimulation. These properties make the mature cell ideally suited for fine intensity discrimination over a wide dynamic range.


Figures

Figure 1
Figure 1. ICa and ΔΔCm responses to a voltage-clamp spike protocol
A and B, ICa and ΔCm from an E17.5 and a P6 IHC, respectively. Top panels show the command protocol consisting of a sine wave (2.5 kHz) that appears as thick solid lines, which is interrupted for the duration of the spike and applied from a holding potential of −71 mV. Middle panels show the inward current elicited by the spike and lower panels show the corresponding ΔCm responses. Note that the region during the spike in the lower panels is blanked as the track-in circuitry is not operational. The recordings in A and B are averages of two and four protocol repetitions, respectively, and the broken horizontal lines represent the zero ΔCm level (as in subsequent figures). E17.5, Cm 5.3 pF; Rs 7.0 MΩ; gleak 0.8 nS. P6, Cm 8.0 pF; Rs 5.3 MΩ; gleak 2.0 nS. C, ICa (top panel) and ΔCm (bottom panel) responses to the spike protocol from a P4 IHC in control conditions (black traces) and during the superfusion of a Ca2+-free solution (grey traces). The recordings in control and Ca2+-free conditions are averages of three and two repetitions, respectively. Cm 7.6 pF; Rs 5.1 MΩ; gleak 1.7 nS. D, ICa and ΔCm elicited by the spike protocol from a P4 IHC in control conditions (black traces) and in the presence of 30 μm nifedipine (grey traces). The recordings in control conditions and during the application of nifedipine are averages of four and nine repetitions, respectively. Cm 7.7 pF; Rs 5.2 MΩ; gleak 1.8 nS. E, developmental changes (E16.5–P6) in the amplitudes of peak ICa (•) and ΔCm (◊) in response to the spike protocol. Solid lines are fits to the ICa and ΔCm data points using eqn (1). Numbers of cells are (E16.5–P6) 3, 2, 8, 9, 5, 4, 1. The broken vertical lines at E18.5 and P6 delineate the period during which apical-coil IHCs are capable of firing spontaneous action potentials.
Figure 2
Figure 2. Comparison of ICa and ΔΔCm responses during IHC development
A, inward current (middle panel) and ΔCm (lower panel) responses from a P6 (black traces) and a P20 (grey traces) IHC. Recordings (unaveraged single traces) were obtained in response to 100 ms voltage steps, in 10 mV increments, from the holding potential of −81 mV. For clarity, only responses to two voltage steps (top panel) are shown and the membrane potentials reached are indicated to the right of the ΔCm traces. P6, Cm 7.0 pF; Rs 6.9 MΩ; gleak 1.3 nS. P20, Cm 8.7 pF; Rs 5.3 MΩ; gleak 3.1 nS. B, average I–V (lower panel, circles) and ΔCmV (upper panel, triangles) curves for peak ICa and ΔCm measured at each voltage step potential in immature (P6–P7, n = 8; black closed symbols) and mature (P16-P20, n = 8; grey open symbols) IHCs. C, average ΔCm (upper panel) and peak ICa (lower panel) responses from IHCs at each stage of development following a 100 ms voltage step to around −11 mV. D, changes in the Ca2+ efficiency of exocytosis during development where all ΔCm values have been normalized to ICa, in response to a voltage step to around −11 mV. Numbers of cells in C and D are (E16.5–P20): 3, 2, 3, 7, 11, 15, 21, 14, 7, 10, 15, 9, 5, 4, 3, 4, 5, 8, 3.
Figure 3
Figure 3. Properties of ICa in immature and mature IHCs
A and B, ICa recorded from a P6 and a P18 IHC in response to 10 ms voltage steps from −81 mV in nominal 10 mV increments; for clarity only five traces are shown. Actual test potentials reached are shown next to the traces. Recordings are averaged from seven (•, P6) and eight (◊, P18) protocol repetitions. Residual capacitative transients have been blanked. P6, Cm 8.6 pF; Rs 4.0 MΩ; gleak 0.9 nS. P18, Cm 10.9 pF; Rs 5.1 MΩ; gleak 1.3 nS. C, average peak I–V curves for ICa at the different test potentials from immature (P6, n = 14) and mature (P18–P20, n = 21) IHCs. Continuous lines are fits obtained using eqn (2) for immature (gmax 7.1 nS, Vrev+48 mV, V1/2−29.3 mV, S 7.2 mV) and mature (gmax 3.8 nS, Vrev+41 mV, V1/2−25.2 mV, S 7.5 mV) cells. D, activation of ICa obtained by plotting the normalized chord conductance against the test potential. Same cells as for panel C. Continuous lines are fits obtained using eqn (3) for immature (gmax 7.1 nS, V1/2−28.7 mV, S 7.5 mV) and mature (gmax 3.8 nS, V1/2−25.6 mV, S 7.1 mV) cells. V1/2 was slightly but significantly (P < 0.0001) different between immature and mature IHCs. E, upper and lower panels show the ICa traces of A and B on an expanded time scale. Continuous lines are fits to the current traces obtained using eqn (4). F, average time constants of activation obtained from the fits to the current traces at different membrane potentials for immature (•, n = 9) and mature (◊, n = 14) IHCs.
Figure 4
Figure 4. Developmental changes in the kinetics of neurotransmitter release
A, ΔCm recordings (single traces) from a P7 IHC in response to voltage steps of different duration, shown next to the traces, to around −11 mV. Cm 8.4 pF; Rs 5.7 MΩ; gleak 0.7 nS. B, average ΔCm values obtained for each voltage step duration (2 ms to 3 s) from immature (•, P3–P10, n = 28) and mature (◊, P16–P20, n = 8) IHCs. P3–P10 and P16–P20 were chosen since the ΔCm/ICa ratios shown in Fig. 2D were very similar within each range. The lines are exponential fits to immature (solid line) and mature (broken line) ΔCm values from 200 ms to 3 s. C, average ΔCm values from B for stimulus durations up to 400 ms on an expanded time scale. ΔCm responses from immature and mature cells showed an initial foot region over the first 100 ms that could be approximated with an exponential function (immature: solid line; mature: broken line). The RRP (below the exponential fits) and secondary pool (above the exponential fits) are indicated.
Figure 5
Figure 5. Synaptic transfer functions relating ICa and ΔΔCm at different membrane potentials
A, average ΔCm responses from E17.5–P3 (▴, n = 12), P6–P7 (•, n = 8) and P16–P20 (◊, n = 8) IHCs plotted against the corresponding absolute ICa magnitude resulting from 100 ms voltage steps from the holding potential of −81 mV to different voltages up to around −11 mV in nominal 10 mV increments. For immature (P6–P7) and mature (P16–P20) IHCs, the data are from the I−V and ΔCmV curves shown in Fig. 2B. Solid lines are fits to data points according to eqn (5) with powers N of: E17.5–P3, 3.3; P6–P7, 3.3; P16–P20, 0.7. The broken horizontal lines (also in B) represent the maximum size of the predicted RRP (from Fig. 4C). B, ICa and ΔCm responses as A but plotted using double-logarithmic coordinates. Straight lines are the same functions used in A with the same parameters.
Figure 6
Figure 6. Dependence of ICa and ΔΔCm on extracellular Ca2+
A, ΔCm (single traces) from four immature IHCs in different extracellular Ca2+ concentrations (indicated above each trace) in response to a 100 ms voltage step to around −11 mV. 1.3 mm (P8), Cm 9.9 pF; Rs 4.3 MΩ; gleak 1.4 nS. 2.5 mm (P6), Cm 8.0 pF; Rs 5.0 MΩ; gleak 0.7 nS. 5 mm (P7), Cm 8.1 pF; Rs 6.6 MΩ; gleak 1.1 nS. 10 mm (P6), Cm 8.0 pF; Rs 5.6 MΩ; gleak 1.4 nS. B and C, peak ICa magnitudes and corresponding ΔCm, respectively, as a function of extracellular Ca2+ for immature (•, P6–P8) and mature (◊, P17–P20) IHCs. Numbers of cells at each concentration are: immature, 8 (0 mm), 20 (1.3 mm), 4 (2.5 mm), 3 (5 mm) and 5 (10 mm); mature, 5 (0 mm), 18 (1.3 mm), 6 (2.5 mm), 11 (5 mm) and 10 (10 mm). Solid lines are fits according to eqn (6) (see Results). D, synaptic transfer functions relating ICa and ΔCm where ΔCm values for each cell at different Ca2+ concentrations are plotted against their corresponding ICa magnitude for immature (filled symbols) and mature (open symbols) IHCs. Immature and mature data points are fit (solid lines) using eqn (5) with powers N of: 3.97 (immature) and 0.62 (mature). E, as D but plotted using double-logarithmic coordinates. Straight lines are the same functions used in D with the same parameters. The Ca2+-free data points shown in D have been omitted. The broken horizontal line represents the maximum size of the predicted RRP (from Fig. 4C).

References

    1. Augustine GJ, Charlton MP. Calcium dependence of presynaptic calcium current and post-synaptic response at the squid giant synapse. J Physiol. 1986;381:619–640. - PMC - PubMed
    1. Augustine GJ, Charlton MP, Smith SJ. Calcium entry and transmitter release at voltage-clamped nerve terminals of squid. J Physiol. 1985;367:163–181. - PMC - PubMed
    1. Beutner D, Moser T. The presynaptic function of mouse cochlear inner hair cells during development of hearing. J Neurosci. 2001;21:4593–4599. - PMC - PubMed
    1. Beutner D, Voets T, Neher E, Moser T. Calcium dependence of exocytosis and endocytosis at the cochlear inner hair cell afferent synapse. Neuron. 2001;29:681–690. - PubMed
    1. Borst JG, Sakmann B. Calcium influx and transmitter release in a fast CNS synapse. Nature. 1996;383:431–434. - PubMed

Publication types

MeSH terms