

NMR relaxation studies on the hydrate layer of intrinsically unstructured proteins
- PMID: 15613629
- PMCID: PMC1305255
- DOI: 10.1529/biophysj.104.051912
NMR relaxation studies on the hydrate layer of intrinsically unstructured proteins
Abstract
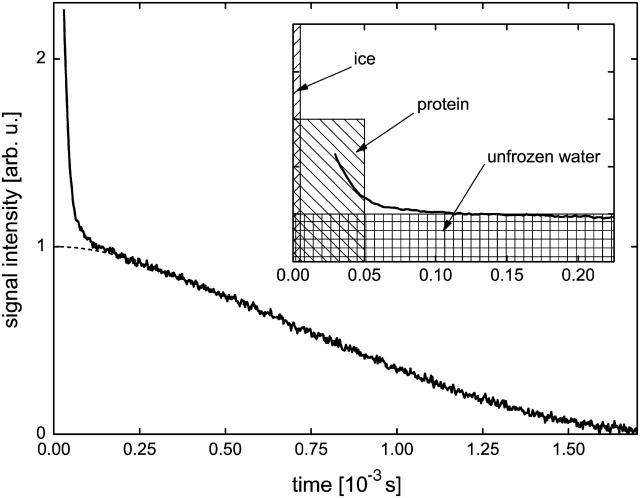
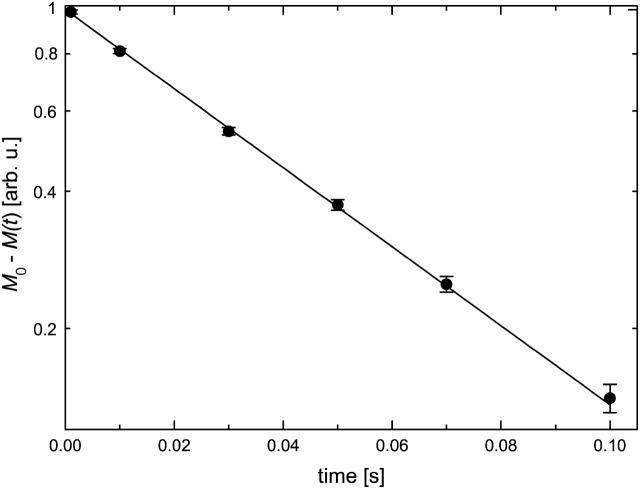
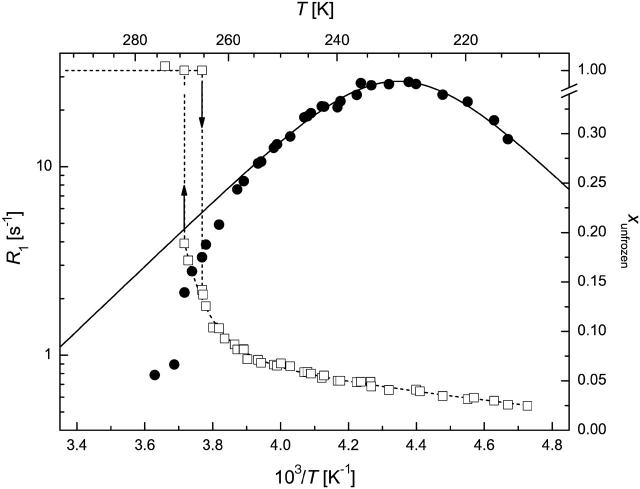
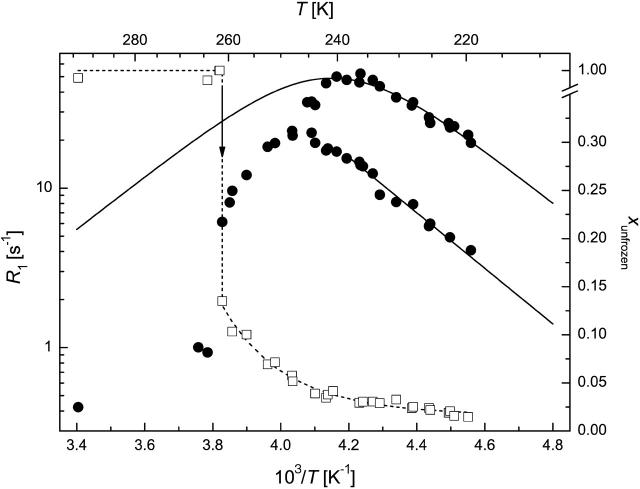
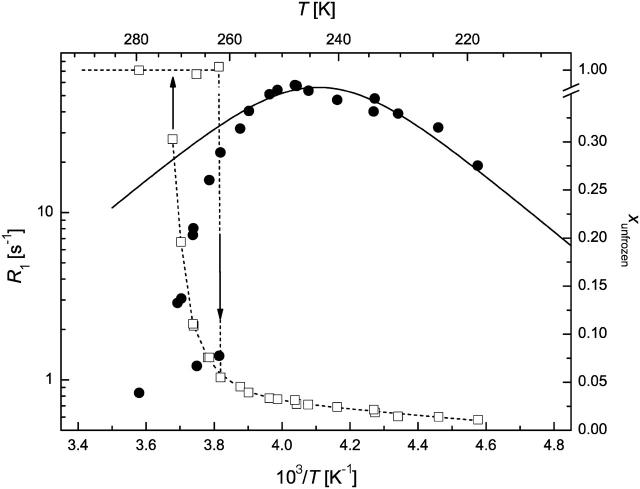
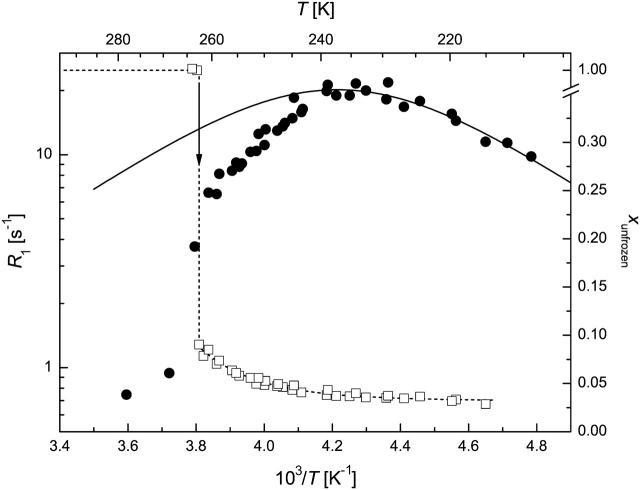
Intrinsically unstructured/disordered proteins (IUPs) exist in a disordered and largely solvent-exposed, still functional, structural state under physiological conditions. As their function is often directly linked with structural disorder, understanding their structure-function relationship in detail is a great challenge to structural biology. In particular, their hydration and residual structure, both closely linked with their mechanism of action, require close attention. Here we demonstrate that the hydration of IUPs can be adequately approached by a technique so far unexplored with respect to IUPs, solid-state NMR relaxation measurements. This technique provides quantitative information on various features of hydrate water bound to these proteins. By freezing nonhydrate (bulk) water out, we have been able to measure free induction decays pertaining to protons of bound water from which the amount of hydrate water, its activation energy, and correlation times could be calculated. Thus, for three IUPs, the first inhibitory domain of calpastatin, microtubule-associated protein 2c, and plant dehydrin early responsive to dehydration 10, we demonstrate that they bind a significantly larger amount of water than globular proteins, whereas their suboptimal hydration and relaxation parameters are correlated with their differing modes of function. The theoretical treatment and experimental approach presented in this article may have general utility in characterizing proteins that belong to this novel structural class.
Figures
References
-
- Alsheikh, M. K., B. J. Heyen, and S. K. Randall. 2003. Ion binding properties of the dehydrin ERD14 are dependent upon phosphorylation. J. Biol. Chem. 278:40882–40889. - PubMed
-
- Antzutkin, O. N. 2002. Molecular structure determination: applications in biology. In Solid-State NMR Spectroscopy. M. J. Duer, editor. Blackwell Science, Oxford.
-
- Barnaal, D. E., and I. J. Lowe. 1967. Experimental free-induction-decay shapes and theoretical second moments for hydrogen in hexagonal ice. J. Chem. Phys. 46:4800–4809.
-
- Bloembergen, N., E. M. Purcell, and R. V. Pound. 1948. Relaxation effects in nuclear magnetic resonance absorption. Phys. Rev. 73:679–712.
-
- Bochicchio, B., and A. M. Tamburro. 2002. Polyproline II structure in proteins: identification by chiroptical spectroscopies, stability, and functions. Chirality. 14:782–792. - PubMed
Publication types
MeSH terms
Substances
LinkOut - more resources
Full Text Sources
Research Materials
