Subcellular distribution of GABA(B) receptor homo- and hetero-dimers
- PMID: 15617512
- PMCID: PMC1186692
- DOI: 10.1042/BJ20041435
Subcellular distribution of GABA(B) receptor homo- and hetero-dimers
Abstract
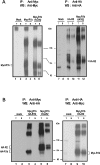
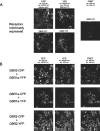
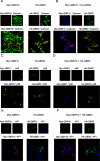
GBRs (GABA(B) receptors; where GABA stands for gamma-aminobutyric acid) are G-protein-coupled receptors that mediate slow synaptic inhibition in the brain and spinal cord. In vitro assays have previously demonstrated that these receptors are heterodimers assembled from two homologous subunits, GBR1 and GBR2, neither of which is capable of producing functional GBR on their own. We have used co-immunoprecipitation in combination with bioluminescence and fluorescence resonance energy transfer approaches in living cells to assess directly the interaction between GBR subunits and determine their subcellular localization. The results show that, in addition to forming heterodimers, GBR1 and GBR2 can associate as stable homodimers. Confocal microscopy indicates that, while GBR1/GBR1 homodimers are retained in the endoplasmic reticulum and endoplasmic reticulum-Golgi intermediate compartment, both GBR2/GBR2 homodimers and GBR1/GBR2 heterodimers are present at the plasma membrane. Although these observations shed new light on the assembly of GBR complexes, they raise questions about the potential functional roles of GBR1 and GBR2 homodimers.
Figures


Similar articles
-
Independent maturation of the GABA(B) receptor subunits GABA(B1) and GABA(B2) during postnatal development in rodent brain.J Comp Neurol. 2004 Sep 20;477(3):235-52. doi: 10.1002/cne.20188. J Comp Neurol. 2004. PMID: 15305362
-
Structure and functional interaction of the extracellular domain of human GABA(B) receptor GBR2.Nat Neurosci. 2012 Jun 3;15(7):970-8. doi: 10.1038/nn.3133. Nat Neurosci. 2012. PMID: 22660477 Free PMC article.
-
GABA(B) receptor heterodimer-component localisation in human brain.Brain Res Mol Brain Res. 2000 Apr 14;77(1):111-24. doi: 10.1016/s0169-328x(00)00047-4. Brain Res Mol Brain Res. 2000. PMID: 10814837
-
GABA(B)-receptor isoforms molecular architecture and distribution.Life Sci. 2001 Apr 6;68(19-20):2297-300. doi: 10.1016/s0024-3205(01)01018-9. Life Sci. 2001. PMID: 11358339 Review.
-
Mechanisms of GABAB receptor exocytosis, endocytosis, and degradation.Adv Pharmacol. 2010;58:93-111. doi: 10.1016/S1054-3589(10)58004-9. Adv Pharmacol. 2010. PMID: 20655479 Review.
Cited by
-
Control of CCR5 Cell-Surface Targeting by the PRAF2 Gatekeeper.Int J Mol Sci. 2023 Dec 13;24(24):17438. doi: 10.3390/ijms242417438. Int J Mol Sci. 2023. PMID: 38139265 Free PMC article.
-
Comparative expression study of the endo-G protein coupled receptor (GPCR) repertoire in human glioblastoma cancer stem-like cells, U87-MG cells and non malignant cells of neural origin unveils new potential therapeutic targets.PLoS One. 2014 Mar 24;9(3):e91519. doi: 10.1371/journal.pone.0091519. eCollection 2014. PLoS One. 2014. PMID: 24662753 Free PMC article.
-
Dendritic assembly of heteromeric gamma-aminobutyric acid type B receptor subunits in hippocampal neurons.J Biol Chem. 2009 May 8;284(19):13077-85. doi: 10.1074/jbc.M900575200. Epub 2009 Mar 10. J Biol Chem. 2009. PMID: 19276079 Free PMC article.
-
GABAB receptor subunit GB1 at the cell surface independently activates ERK1/2 through IGF-1R transactivation.PLoS One. 2012;7(6):e39698. doi: 10.1371/journal.pone.0039698. Epub 2012 Jun 28. PLoS One. 2012. PMID: 22761875 Free PMC article.
-
Up-regulation of GABA(B) receptor signaling by constitutive assembly with the K+ channel tetramerization domain-containing protein 12 (KCTD12).J Biol Chem. 2013 Aug 23;288(34):24848-56. doi: 10.1074/jbc.M113.476770. Epub 2013 Jul 10. J Biol Chem. 2013. PMID: 23843457 Free PMC article.
References
-
- Hevers W., Luddens H. The diversity of GABAA receptors. Pharmacological and electrophysiological properties of GABAA channel subtypes. Mol. Neurobiol. 1998;18:35–86. - PubMed
-
- Johnston G. A. GABAc receptors: relatively simple transmitter-gated ion channels? Trends Pharmacol. Sci. 1996;17:319–323. - PubMed
-
- Kerr D. I., Ong J. GABAB receptors. Pharmacol. Ther. 1995;67:187–246. - PubMed
-
- Mott D. D., Lewis D. V. The pharmacology and function of central GABAB receptors. Int. Rev. Neurobiol. 1994;36:97–223. - PubMed
-
- Couve A., Moss S. J., Pangalos M. N. GABAB receptors: a new paradigm in G protein signaling. Mol. Cell. Neurosci. 2000;16:296–312. - PubMed
Publication types
MeSH terms
Substances
LinkOut - more resources
Full Text Sources
Molecular Biology Databases

