. 2005 Jan;73(1):88-102.
doi: 10.1128/IAI.73.1.88-102.2005.

Transcriptional adaptation of Shigella flexneri during infection of macrophages and epithelial cells: insights into the strategies of a cytosolic bacterial pathogen

Affiliations

Transcriptional adaptation of Shigella flexneri during infection of macrophages and epithelial cells: insights into the strategies of a cytosolic bacterial pathogen

Sacha Lucchini et al. Infect Immun. 2005 Jan.

Abstract

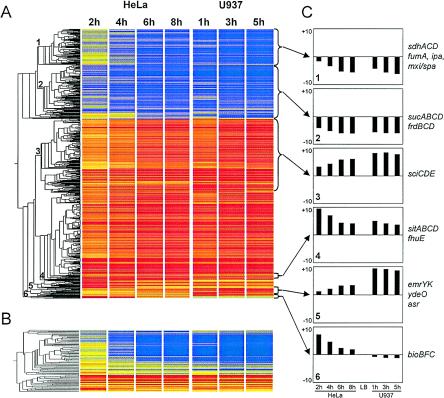
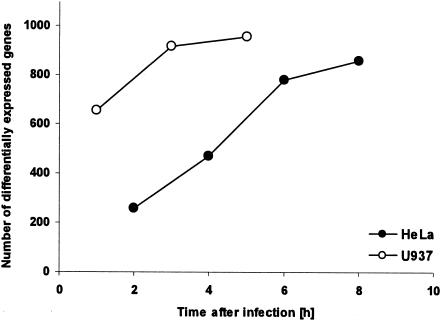
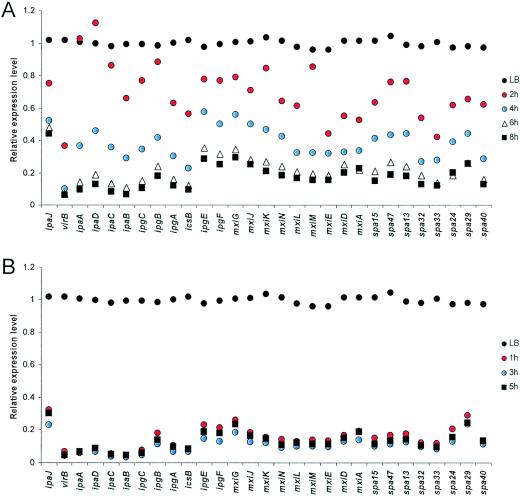
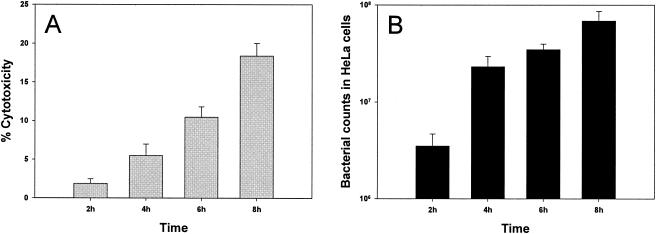
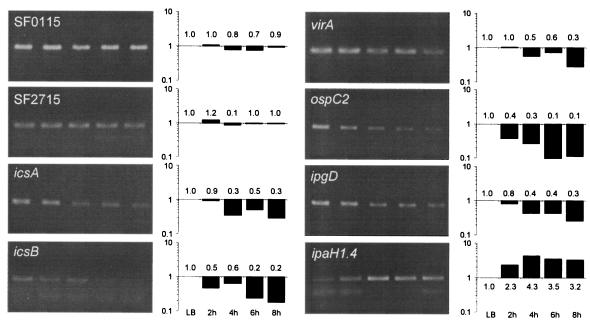
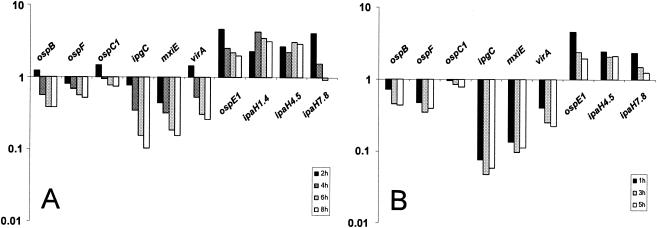
Shigella flexneri, the etiologic agent of bacillary dysentery, invades epithelial cells as well as macrophages and dendritic cells and escapes into the cytosol soon after invasion. Dissection of the global gene expression profile of the bacterium in its intracellular niche is essential to fully understand the biology of Shigella infection. We have determined the complete gene expression profiles for S. flexneri infecting human epithelial HeLa cells and human macrophage-like U937 cells. Approximately one quarter of the S. flexneri genes showed significant transcriptional adaptation during infection; 929 and 1,060 genes were up- or down-regulated within HeLa cells and U937 cells, respectively. The key S. flexneri virulence genes, ipa-mxi-spa and icsA, were drastically down-regulated during intracellular growth. This theme seems to be common in bacterial infection, because the Ipa-Mxi-Spa-like type III secretion systems were also down-regulated during mammalian cell infection by Salmonella enterica serovar Typhimurium and Escherichia coli O157. The bacteria experienced restricted levels of iron, magnesium, and phosphate in both host cell types, as shown by up-regulation of the sitABCD system, the mgtA gene, and genes of the phoBR regulon. Interestingly, ydeO and other acid-induced genes were up-regulated only in U937 cells and not in HeLa cells, suggesting that the cytosol of U937 cells is acidic. Comparison with the gene expression of intracellular Salmonella serovar Typhimurium, which resides within the Salmonella-containing vacuole, indicated that S. flexneri is exposed to oxidative stress in U937 cells. This work will facilitate functional studies of hundreds of novel intracellularly regulated genes that may be important for the survival and growth strategies of Shigella in the human host.


Figures

FIG. 1.
FIG. 1.
Size chromatographic separation of RNAs. Total RNAs were extracted from intracellular S. flexneri bacteria as described in the text. Results for samples from the first time points of U937 cell (Sf301 ex U937) and HeLa cell (SF301 ex HeLa) infections are shown. Total RNAs extracted from a bacterial LB culture (Sf301) and uninfected U937 cells (U937) were used as controls to verify the purity of the intracellular bacterial RNAs.
FIG. 2.
FIG. 2.
Gene expression profiles for Shigella during infection of HeLa and U937 cells. (A) Cluster diagram of the expression profile of 1,256 chromosomal genes showing statistically different levels of expression during infection of HeLa or U937 cells relative to the data for the reference LB culture. Each horizontal line represents one gene. Red indicates at least a twofold increase, yellow indicates no change, and blue indicates a minimum twofold decrease in expression. (B) Cluster diagram of the expression profile of 80 plasmid pCP301-borne genes. Hierarchical clustering was performed by using Genespring 6.2 with the Pearson correlation. (C) Average relative levels of expression of representative clusters. The vertical axis shows the fold change in expression for each gene on a logarithmic scale. Examples of genes corresponding to the various profiles are given.
FIG. 3.
FIG. 3.
Differential expression of S. flexneri genes divided into functional groups. Bars indicate percentages of genes in each group that showed significant changes in expression in HeLa (A) and U937 (B) cells. The white bars show the percentages of S. flexneri genes up-regulated and the black bars show the percentages of genes down-regulated during intracellular growth. Genes were divided into functional categories by using the Comprehensive Microbial Resource described by Peterson et al. (57). A.a., amino acid; int. metab., intermediary metabolism; hypoth. Prot., hypothetical protein; bind., prot., binding protein.
FIG. 4.
FIG. 4.
Time-dependent transcriptional adaptation of S. flexneri in U937 and HeLa cells. The graph shows the total number of Shigella genes which were significantly differentially expressed (more than threefold) at each time point for both U937 and HeLa cells.
FIG. 5.
FIG. 5.
Time-dependent down-regulation of the ipa and mxi/spa virulence genes during infection of HeLa (A) and U937 (B) cells.
FIG. 6.
FIG. 6.
S. flexneri cytotoxicity for and growth inside epithelial cells. The bar graphs show the cytotoxic effect resulting from S. flexneri infection of HeLa cells (see Materials and Methods for details) (A) and the rate of S. flexneri replication inside HeLa cells (B). Values represent the means of measurements from three wells, and error bars indicate standard deviations.
FIG. 7.
FIG. 7.
Validation of microarray results by RT-PCR. The agarose gel analysis of the PCR fragments obtained after RT-PCR is shown along with the quantification of the corresponding bands (bar graphs). Numbers associated with the bars indicate fold differences relative to the data for the reference LB culture, which were established by densitometric analysis. Samples were isolated at 2, 4, 6, and 8 h after Shigella infection of HeLa cells, and data for these samples can be compared directly with data from the microarray experiment. The RNA used for RT-PCR was isolated from an infection independent from the infections used for gene expression profiling. One RNA sample was isolated from a mid-log LB culture and was used as a reference. Genes SF2715 and SF0115 were chosen as controls because they did not show any significant change in expression in the microarray experiment.
FIG. 8.
FIG. 8.
Expression of genes of the mxiE regulon in HeLa (A) and U937 (B) cells. The bar graphs show the levels of expression at all times relative to the data for the LB culture. The results for the ipaH1.4 gene are from RT-PCR (Fig. 7).

References

    1. Andrews, G. P., A. E. Hromockyj, C. Coker, and A. T. Maurelli. 1991. Two novel virulence loci, mxiA and mxiB, in Shigella flexneri 2a facilitate excretion of invasion plasmid antigens. Infect. Immun. 59:1997-2005. - PMC - PubMed
    1. Anjum, M. F., S. Lucchini, A. Thompson, J. C. Hinton, and M. J. Woodward. 2003. Comparative genomic indexing reveals the phylogenomics of Escherichia coli pathogens. Infect. Immun. 71:4674-4683. - PMC - PubMed
    1. Bartoleschi, C., M. C. Pardini, C. Scaringi, M. C. Martino, C. Pazzani, and M. L. Bernardini. 2002. Selection of Shigella flexneri candidate virulence genes specifically induced in bacteria resident in host cell cytoplasm. Cell. Microbiol. 4:613-626. - PubMed
    1. Benjamini, Y., and Y. Hochberg. 1995. Controlling the false discovery rate: a practical and powerful approach to multiple testing. J. R. Stat. Soc. 57: 289-300.
    1. Bernardini, M. L., M. G. Sanna, A. Fontaine, and P. J. Sansonetti. 1993. OmpC is involved in invasion of epithelial cells by Shigella flexneri. Infect. Immun. 61:3625-3635. - PMC - PubMed

Publication types

MeSH terms

LinkOut - more resources