. 2005 Jan;73(1):546-51.
doi: 10.1128/IAI.73.1.546-551.2005.

Replication dynamics of Mycobacterium tuberculosis in chronically infected mice

Affiliations

Replication dynamics of Mycobacterium tuberculosis in chronically infected mice

Ernesto J Muñoz-Elías et al. Infect Immun. 2005 Jan.

Abstract

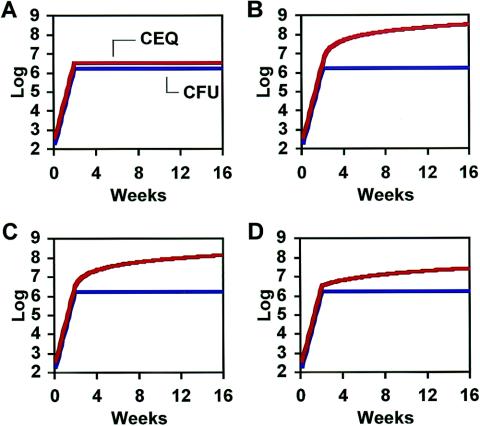
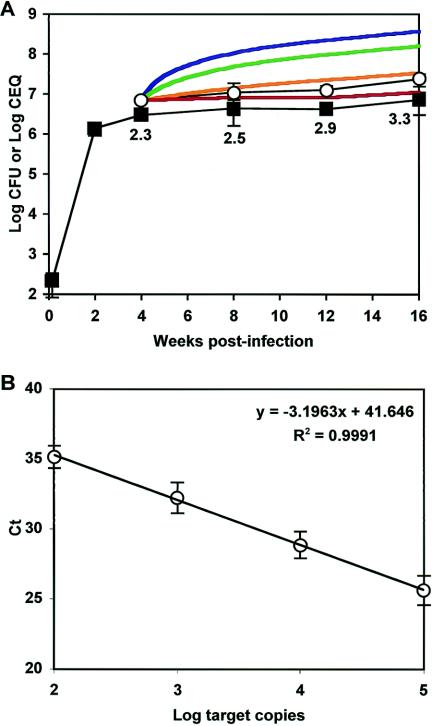
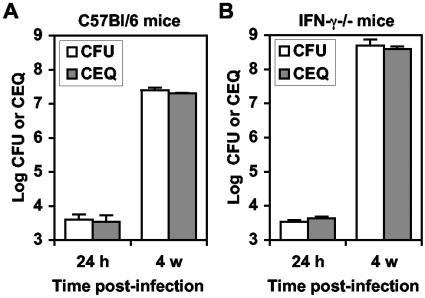
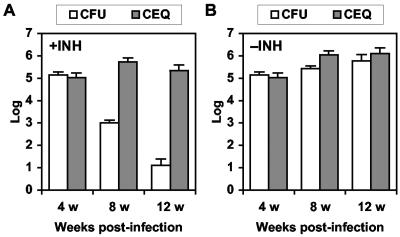
The dynamics of host-pathogen interactions have important implications for the design of new antimicrobial agents to treat chronic infections such as tuberculosis (TB), which is notoriously refractory to conventional drug therapy. In the mouse model of TB, an acute phase of exponential bacterial growth in the lungs is followed by a chronic phase characterized by relatively stable numbers of bacteria. This equilibrium could be static, with little ongoing replication, or dynamic, with continuous bacterial multiplication balanced by bacterial killing. A static model predicts a close correspondence between "viable counts" (live bacteria) and "total counts" (live plus dead bacteria) in the lungs over time. A dynamic model predicts the divergence of total counts and viable counts over time due to the accumulation of dead bacteria. Here, viable counts are defined as bacterial CFU enumerated by plating lung homogenates; total counts are defined as bacterial chromosome equivalents (CEQ) enumerated by using quantitative real-time PCR. We show that the viable and total bacterial counts in the lungs of chronically infected mice do not diverge over time. Rapid degradation of dead bacteria is unlikely to account for the stability of bacterial CEQ numbers in the lungs over time, because treatment of mice with isoniazid for 8 weeks led to a marked reduction in the number of CFU without reducing the number of CEQ. These observations support the hypothesis that the stable number of bacterial CFU in the lungs during chronic infection represents a static equilibrium between host and pathogen.


Figures

FIG. 1.
FIG. 1.
Modeling static and dynamic scenarios of the host-pathogen equilibrium in chronic murine TB. Mice are infected with 200 CFU. Acute-phase infection (0 to 2 weeks) is characterized by an exponential increase in viable counts (CFU), with a 24.6-h population doubling time. Chronic-phase infection (2 to 16 weeks) is characterized by stable viable counts. (A) Static scenario. CMI halts bacterial replication after the acute phase of infection. Viable counts (CFU) (blue line) and total counts (CEQ) (red line) do not diverge over time. (B) Dynamic scenario. Bacterial replication continues at an undiminished rate (doubling time, 24.6 h) throughout the chronic phase, but bactericidal CMI kills 50% of the bacteria after each round of cell division. Balanced growth and death result in stable viable counts while total counts accumulate, resulting in rapid divergence of CEQ and CFU. (C and D) Semidynamic scenarios where the rate of bacterial cell division is reduced by 50% (C) or 90% (D) from the acute-phase rate, resulting in more-gradual divergence of CEQ and CFU.
FIG. 2.
FIG. 2.
Comparison of modeled and experimentally determined CFU and CEQ curves in mice. (A) C57BL/6 mice were aerosol infected with M. tuberculosis (∼200 CFU per mouse). At 24 h and at 2, 4, 8, 12, and 16 weeks postinfection, groups of mice were sacrificed and lungs were removed. Viable counts (CFU) were quantified by plating serial dilutions of lung homogenates (filled squares); total counts (CEQ) were quantified by QPCR (open circles). Modeled CEQ values were derived by using the static (red line) or dynamic (blue line) equilibrium scenario, or a semidynamic scenario in which the rate of cell division during chronic infection was reduced by 50% (green line) or 90% (orange line) from the acute-infection rate. Symbols represent mean CFU or CEQ values (n = 4 mice per group); error bars, standard deviations. Numbers below curves indicate CEQ/CFU ratios at the corresponding time points. P values for pairwise comparisons of the experimental and modeled CEQ values at 16 weeks were as follows: for the experimental versus the dynamic or semidynamic (50%) scenario, P < 0.001; for the experimental versus the static or semidynamic (10%) scenario, P > 0.05. Results are representative of two experiments. (B) Standard curve for the fadE15 primer-beacon set used to quantify bacterial CEQ in tissue homogenates. Ct values (y axis) were obtained by QPCR of 102, 103, 104, or 105 copies of the target DNA (x axis). Symbols (open circles) represent mean Ct values from three independent experiments where n ≥ 2 replicates per experiment; error bars, standard deviations. The trend line drawn through the data points indicates the linear regression curve, which was calculated by using the least-squares method.
FIG. 3.
FIG. 3.
Quantification of M. tuberculosis CEQ in mouse lungs is not limited by a detection ceiling at high bacterial loads. C57BL/6 mice (A) and IFN-γ−/− mice (B) were aerosol infected with M. tuberculosis (∼4,000 CFU per mouse). At 24 h and 4 weeks (w) postinfection, mice were sacrificed and lungs were removed for analysis. Viable counts were quantified by plating serial dilutions of lung homogenates for CFU (open bars); total counts (CEQ) were quantified by QPCR (shaded bars). Bars represent mean CFU or CEQ values (n = 4 mice per group); error bars, standard deviations. This experiment was performed once.
FIG. 4.
FIG. 4.
Chromosomes of nonviable M. tuberculosis in mouse lungs are not removed or degraded rapidly. C57BL/6 mice were infected intravenously with M. tuberculosis (∼106 CFU per mouse). One group (A) received INH (25 mg kg−1 day−1) for 8 weeks starting at 4 weeks postinfection; a control group (B) was left untreated. At 4, 8, and 12 weeks postinfection, mice from INH-treated and untreated groups were sacrificed and lungs were removed. Viable counts (CFU) were quantified by plating serial dilutions of lung homogenates (open bars); total counts (CEQ) were quantified by QPCR (shaded bars). Bars represent mean CFU or CEQ values (n = 4 mice per group); error bars, standard deviations from the means. In pairwise comparisons of CFU values in the INH-treated group for 4 versus 8 weeks or 4 versus 12 weeks postinfection, differences were highly significant (P < 0.005). In pairwise comparisons of CEQ values in the INH-treated group for 4 versus 8 weeks or 4 versus 12 weeks postinfection, differences were not significant (P > 0.05). Results are representative of two experiments.

References

    1. Bouley, D. M., N. Ghori, K. L. Mercer, S. Falkow, and L. Ramakrishnan. 2001. Dynamic nature of host-pathogen interactions in Mycobacterium marinum granulomas. Infect. Immun. 69:7820-7831. - PMC - PubMed
    1. Cole, S. T. 2002. Comparative and functional genomics of the Mycobacterium tuberculosis complex. Microbiology 148:2919-2928. - PubMed
    1. Cooper, A. M., D. K. Dalton, T. A. Stewart, J. P. Griffin, D. G. Russell, and I. M. Orme. 1993. Disseminated tuberculosis in interferon γ gene-disrupted mice. J. Exp. Med. 178:2243-2247. - PMC - PubMed
    1. Deitsch, K. W., E. R. Moxon, and T. E. Wellems. 1997. Shared themes of antigenic variation and virulence in bacterial, protozoal, and fungal infections. Microbiol. Mol. Biol. Rev. 61:281-293. - PMC - PubMed
    1. de Wit, D., M. Wootton, J. Dhillon, and D. A. Mitchison. 1995. The bacterial DNA content of mouse organs in the Cornell model of dormant tuberculosis. Tuber. Lung Dis. 76:555-562. - PubMed

Publication types