Comparative Study
. 2005 Apr 1;564(Pt 1):3-19.
doi: 10.1113/jphysiol.2004.077446. Epub 2004 Dec 23.

Microelectrode array recordings of cultured hippocampal networks reveal a simple model for transcription and protein synthesis-dependent plasticity

Affiliations
Comparative Study

Microelectrode array recordings of cultured hippocampal networks reveal a simple model for transcription and protein synthesis-dependent plasticity

Fiona J L Arnold et al. J Physiol. .

Abstract

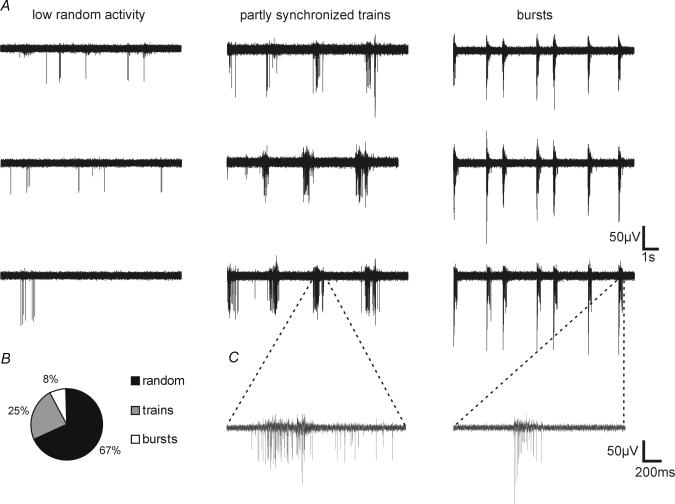
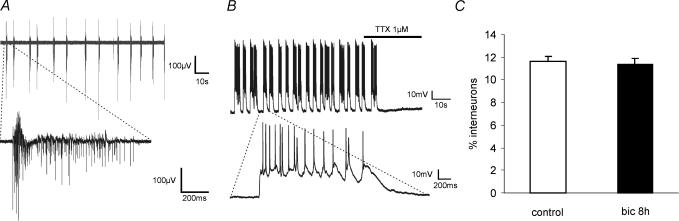
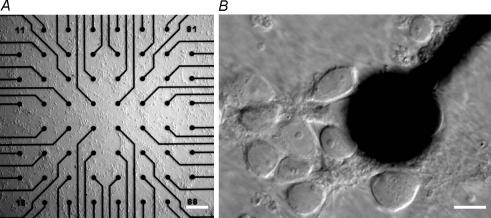
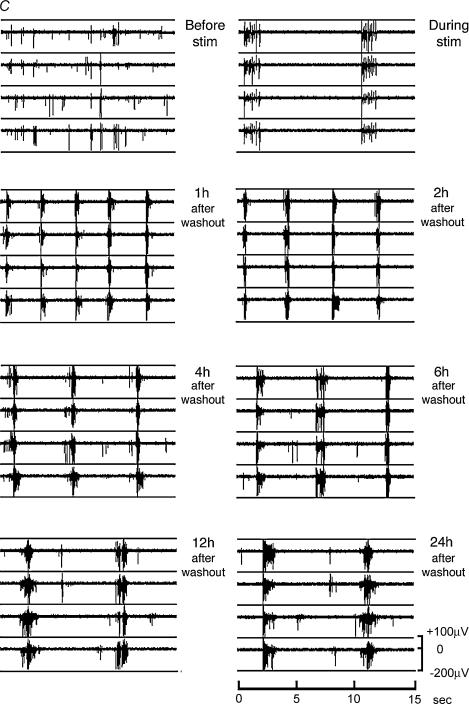
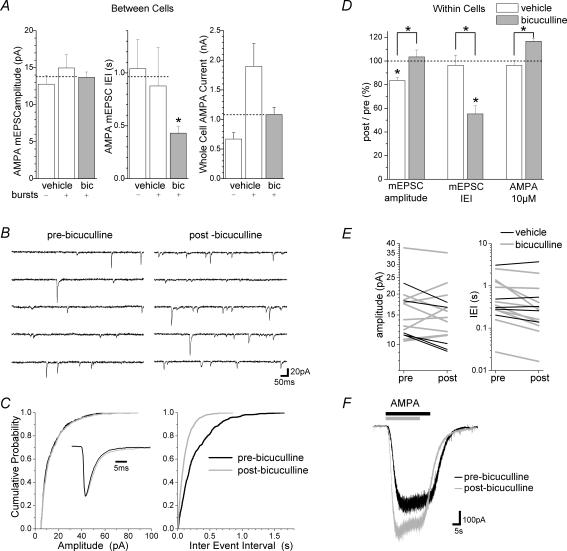
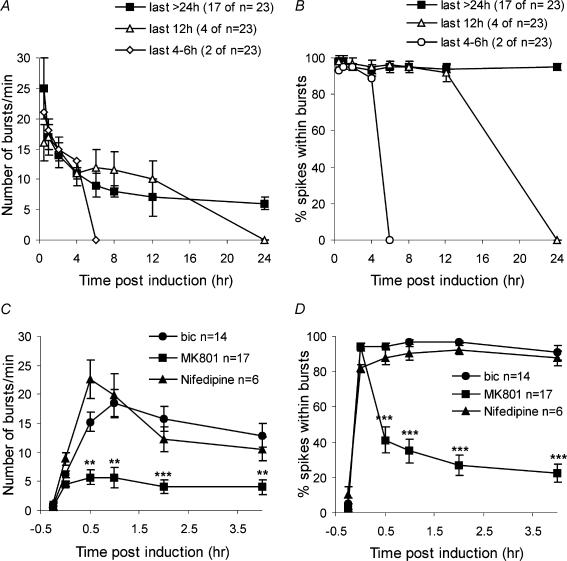
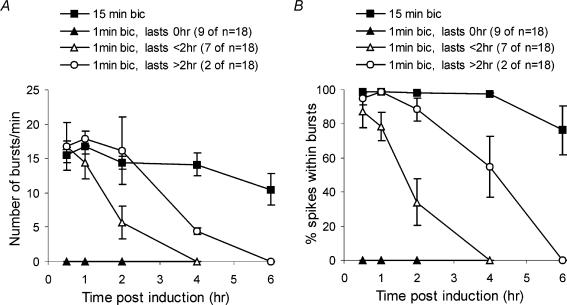
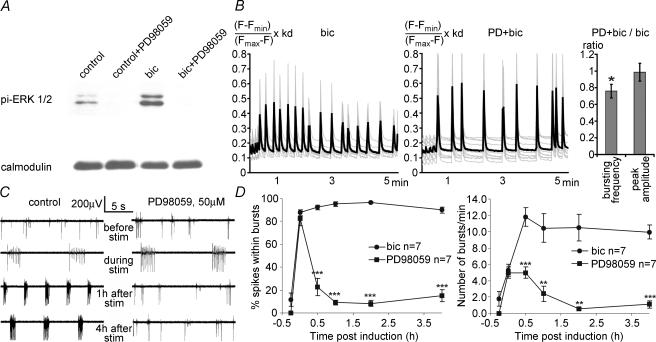
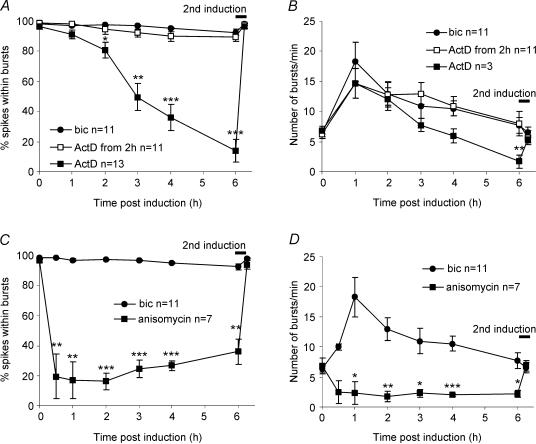
A simplified cell culture system was developed to study neuronal plasticity. As changes in synaptic strength may alter network activity patterns, we grew hippocampal neurones on a microelectrode array (MEA) and monitored their collective behaviour with 60 electrodes simultaneously. We found that exposure of the network for 15 min to the GABA(A) receptor antagonist bicuculline induced an increase in synaptic efficacy at excitatory synapses that was associated with an increase in the frequency of miniature AMPA receptor-mediated EPSCs and a change in network activity from uncoordinated firing of neurones (lacking any recognizable pattern) to a highly organized, periodic and synchronous burst pattern. Induction of recurrent synchronous bursting was dependent on NMDA receptor activation and required extracellular signal-regulated kinase (ERK)1/2 signalling and translation of pre-existing mRNAs. Once induced, the burst pattern persisted for several days; its maintenance phase (> 4 h) was dependent on gene transcription taking place in a critical period of 120 min following induction. Thus, cultured hippocampal neurones display a simple, transcription and protein synthesis-dependent form of plasticity. The non-invasive nature of MEA recordings provides a significant advantage over traditional assays for synaptic connectivity (i.e. long-term potentiation in brain slices) and facilitates the search for activity-regulated genes critical for late-phase plasticity.


Figures

Figure 1
Figure 1. MEA recordings of spontaneous activity in cultured hippocampal networks
A, for each type of spontaneous network firing (i.e. low random activity, partly synchronized trains, and bursts) one typical example with MEA recordings from 3 separate electrodes is shown. B, distribution of the observed type of spontaneous activity in 197 cultured hippocampal networks. C, expanded traces illustrate examples of a single spike train and a burst.
Figure 2
Figure 2. MEA and current clamp recordings of bicuculline-induced bursting
A, a typical 2 min MEA recording from a hippocampal network during exposure to bicuculline (50 μm) and an expanded trace of an individual burst are shown. B, a current clamp recording from a hippocampal culture exposed to bicuculline (50 μm) reveals a strong depolarization accompanying each burst of action potentials. This depolarizing shift was blocked by tetrodotoxin (1 μm). The expanded trace (beneath) shows that individual cells typically fired 10–20 action potentials per burst. C, induction of sustained recurrent activity by synaptic NMDA receptors leaves the percentage of interneurones in the network unchanged (P= 0.569, n= 3 for each group, independent samples t test). The percentage of GABAergic interneurones in control hippocampal networks (control) and in networks exposed for 8 h to 50 μm bicuculline (bic 8 h). Inhibitory interneurones were identified by GABA immunostaining and expressed as a percentage of the total number of cells identified by Hoechst staining. Bicuculline treatment does not lead to an increase in the number of apoptotic or necrotic neurones (Hardingham et al. 2002).
Figure 3
Figure 3. Induction of recurrent synchronous bursting in cultured hippocampal networks
A, hippocampal cells cultured on a microelectrode array. Inter-electrode distance is 200 μm, electrode diameter is 30 μm (bar: 200 μm). B, a single electrode at higher magnification (bar: 10 μm). C, a typical example of an MEA recording from a hippocampal network before, during and after exposure to bicuculline (50 μm) to trigger trains of action potentials. Simultaneous recordings from 4 separate electrodes are shown in each panel. The trains of action potentials observed during the bicuculline exposure are about 1.5 s long and recur regularly with a frequency of about 6 trains per minute. After washout of bicuculline the network shows a highly organized, synchronous and periodic burst pattern; at 1 h after washout, the length of the bursts is 0.55 s and their frequency is 20 per minute, gradually changing to a duration of 0.8 s and a frequency of 8 per minute at 24 h after washout.
Figure 4
Figure 4. Changes in mEPSCs and whole-cell AMPA currents following bicuculline-induced bursting
A, histograms show the group mean ±s.e.m. from mean values in each cell for mEPSC amplitude, inter-event interval (IEI) and the amplitude of responses to bath-applied AMPA (10 μm) in the presence of tetrodotoxin (1 μm). Prior to recordings, networks had been treated with either bicuculline (bic) or vehicle for 15 min followed by a 30 min washout period. Vehicle-treated cells were divided into those exhibiting or not exhibiting bursting activity (bursts) during cell-attached and current clamp recordings. All bicuculline-treated cells showed bursting activity. Dashed lines represent the mean of the combined vehicle treated groups which differed from the bicuculline-treated group with respect to mEPSC inter-event interval but not mEPSC amplitude or AMPA response amplitude (P= 0.022, P= 0.94 and P= 0.98, respectively; independent t tests; n= 6–8 for non-bursting vehicle-treated, n= 7–10 for bursting vehicle-treated, n= 16–20 for bicuculline-treated cells). B, consecutive sweeps show mEPSCs recorded from the same cell before (pre-bicuculline) and after (post-bicuculline) the bicuculline treatment protocol (i.e. 15 min bicuculline followed by 30 min washout in current clamp recording conditions). C, cumulative probability histograms generated from the cell shown in B indicate a reduced inter-event interval (IEI) but no change in amplitude following bicuculline treatment (IEI: P < 0.0001, amplitude: P= 0.27; Kolmogorov-Smirnov tests). The inset shows a scaled superimposed average of scaled mEPSCs recorded in both conditions. D and E, histograms (D) show the group mean ±s.e.m. of normalized (post-treatment/pre-treatment) mean values for amplitude and inter-event interval of AMPA receptor-mediated mEPSCs recorded from each cell before and after bicuculline (n= 10) or vehicle (n= 5) treatment protocols. Line series plots (E) show the individual means for amplitude (left) and inter-event interval (IEI, right) in each cell before (pre) and after (post) bicuculline (grey lines) or vehicle (black lines) treatments. Each line connects mean values from the same cell. No consistent change in mEPSC amplitude occurred following bicuculline treatment (increased amplitude in 3 cells, P < 0.0001; decreased amplitude in 3 cells, P < 0.001; no change in 4 cells, P > 0.15 Kolmogorov-Smirnov tests; P= 0.84 group mean comparison of pre- and post-values in all bicuculline-treated cells with paired t test). Bicuculline treatment reduced the mEPSC inter-event interval (P < 0.0001 in 9 cells, P= 0.24 in 1 cell Kolmogorov-Smirnov tests; P= 0.024 group mean comparison of pre- and post-values in all bicuculline-treated cells with paired t test). Vehicle treatment caused a decrease in mEPSC amplitude in all cells (n= 5, P < 0.02 for all cells with Kolmogorov-Smirnov tests, P= 0.024 group mean comparison of pre- and post-values in all vehicle-treated cells with paired t test). No change in mEPSC inter-event interval was apparent following vehicle treatment (no change in 3 cells, P > 0.1; decreased IEI in 1 cell, P < 0.01; increased IEI in 1 cell, P < 0.02 Kolmogorov-Smirnov tests; P= 0.39 group mean comparison of pre- and post-values in all vehicle-treated cells with paired t test). The differences between bicuculline- and vehicle-treatment groups were significant for mEPSC amplitude and inter-event interval (see asterisks above the dashed line in D; amplitude: P= 0.036; IEI: P= 0.004; comparison of normalized mean values from all bicuculline-treated cells with those from all vehicle-treated cells using independent samples t tests). F, overlaid current responses to bath application of AMPA (10 μm) from the same cell before and after the bicuculline protocol. Peak responses were measured in cells before and after the bicuculline- or the vehicle-treatment protocols and the group mean ±s.e.m. of normalized responses is shown in the histogram in D. Although AMPA response size did not differ from its pre-treatment measurement in either bicuculline- or vehicle-treatment groups (bicuculline group: P= 0.12, n= 4; vehicle group: P= 0.63, n= 4; comparison between pre- and post-treatment response values from all cells using paired t tests), the difference between bicuculline- and vehicle-treatment groups was significant (P= 0.008, comparison of normalized responses from all bicuculline-treated cells with those of vehicle-treated cells using an independent samples t test; see asterisk at top right of D).
Figure 5
Figure 5. Calcium flux through synaptic NMDA receptors initiates recurrent synchronous bursting
A and B, quantitative analysis of the number of bursts per minute and the percentage of spikes within bursts from 23 experiments. The behaviour of the networks was grouped into three categories based on the duration of the maintenance phase of oscillatory synchrony (more than 24 h; 12 h; 4–6 h). The frequency of the bursts gradually declined from 25.2 ± 4.9 min−1 at 30 min (or 16.9 ± 1.9 min−1 at 1 h) after bicuculline washout to 7.6 ± 0.6 min−1 at 24 h after bicuculline washout. The percentage of spikes within bursts ranged from 98.9 ± 0.6% at 1 h after washout to 96.5 ± 0.8% at 24 h after washout. The duration of the bursts ranged from 0.57 ± 0.05 s at 1 h after washout to 0.79 ± 0.08 s at 24 h after washout; the number of spikes per burst ranged from 67.4 ± 6.3 at 30 min after washout to 91.8 ± 13.1 at 24 h after washout; the spike frequency within bursts ranged from 132.1 ± 11.2 Hz at 1 h after washout to 119.2 ± 8.9 Hz at 24 h after washout; the peak frequency of spikes within bursts was 459.6 ± 6.7 Hz at 1 h after washout and 459.6 ± 6.2 Hz at 24 h after washout; the number of spikes per minute expressed as a percentage of pre-induction levels was 258% at 1 h after washout and 143% at 24 h after washout. At the end of each experiment, the hippocampal networks were stimulated again with 50 μm bicuculline; this stimulation gave rise to recurrent synchronous bursting that was virtually identical to that obtained following the initial stimulation with 50 μm bicuculline (data not shown). C and D, the NMDA receptor antagonist MK-801 (10 μm) did not affect spontaneous electrical activity or activity during bicuculline (bic) exposure (Hardingham et al. 2002), but inhibited the induction of sustained recurrent activity by the 15 min long exposure to bicuculline (50 μm). Analysis of 17 cultures revealed that the number of spikes per minute and the percentage of spikes within bursts during bicuculline application did not differ between control cultures and cultures treated with MK-801. However, 4 h after bicuculline washout the number of bursts per minute decreased from 12.9 ± 2.0 (control) to 4.0 ± 1.3 (MK-801). The percentage of spikes within bursts decreased from 90.9 ± 4.1% (control) to 22.7 ± 5.2% (MK-801). Induction and maintenance of recurrent synchronous bursting was little affected by the blockade of L-type voltage-gated calcium channels with nifedipine (20 μm). For each time point, cultures treated with MK-801 or nifedipine were compared with controls by an independent samples t test. *P < 0.01, **P < 0.001, ***P < 0.0001. At the end of each experiment, the hippocampal networks were again stimulated with 50 μm bicuculline; this stimulation gave rise to recurrent synchronous bursting that was virtually identical to that obtained during the initial stimulation with 50 μm bicuculline (data not shown).
Figure 6
Figure 6. Induction of recurrent synchronous bursting has a stimulus-duration threshold
Quantitative analysis of the number of bursts per minute (A) and the percentage of spikes within bursts (B) revealed that stimulation of hippocampal networks for 1 min with 50 μm bicuculline led to either no induction of sustained recurrent activity (9 out of 18 experiments), or induced it for 1–2 h (7 out of 18 experiments), or for 2–4 h (2 out of 18 experiments). Analysis of the experiments in which a temporary burst pattern was induced showed that the duration of these bursts, the number of spikes per burst, and the mean and peak spike frequencies within bursts were similar to the values obtained in hippocampal networks stimulated for 15 min with 50 μm bicuculline; the percentage of spikes within bursts and the percentage increase in the number of spikes per minute was reduced compared with the 15 min stimulation protocol (data not shown). At the end of the experiment, the hippocampal networks, previously stimulated with bicuculline for 1 min, were stimulated again with 50 μm bicuculline for 15 min; this gave rise to recurrent synchronous bursting that was virtually identical to that obtained in naive networks stimulated with 50 μm bicuculline for 15 min (data not shown).
Figure 7
Figure 7. ERK1/2 signalling controls induction of recurrent synchronous bursting
A, Western blot analysis of ERK1/2 phosphorylation in hippocampal neurones stimulated for 7 min with bicuculline (50 μm) in the presence or absence of 100 μm PD 98059. PD 98059 treatment started 1 h before bicuculline stimulation. Calmodulin expression was used as the loading control. B, typical example of results from an imaging experiment showing global calcium transients in hippocampal neurones during a 240 s exposure to bicuculline (bic, 50 μm) in the presence (middle panel) or absence (left panel) of the MEK inhibitor PD 98059 (PD, 50 μm). The ratio of the peak size and frequency of the calcium signals obtained with bicuculline treatment versus bicuculline treatment in the presence of PD 98059 is given (right panel, n= 26). Statistically significant differences (P < 0.05, two-tailed, independent samples t test) between PD 98059 + bicuculline and bicuculline are indicated with an asterisk. C, typical examples of MEA recordings from hippocampal networks before, during and after exposure to bicuculline (50 μm) in the presence or absence of 50 μm PD 98059. PD 98059 treatment started 1 h before bicuculline stimulation. D, quantitative analysis of the number of bursts per minute and the percentage of spikes within bursts. Thirty minutes after washout of bicuculline, the percentage of spikes within bursts decreased from 92.3 ± 2.0% (control) to 22.7 ± 7.4% (PD 98059). The number of bursts per minute decreased from 11.8 ± 1.1 (control) to 5.0 ± 0.7 (PD 98059). For each time point, cultures treated with PD 98059 were compared with controls with an independent samples t test. *P < 0.01, **P < 0.001, ***P < 0.0001.
Figure 8
Figure 8. The maintenance of recurrent synchronous bursting is dependent on gene transcription and on-going protein synthesis
A and B, the switch in hippocampal network behaviour was analysed in the presence of 10 μg ml−1 actinomycin D (ActD), an inhibitor of gene transcription. The effects of adding actinomycin D 15 min before and 2 h after bicuculline stimulation on indices of network bursting activity (i.e. number of bursts per minute and the percentage of spikes within bursts) were compared (n=13). The activity pattern observed during bicuculline stimulation was unaffected by actinomycin D (data not shown). In networks treated with actinomycin D before bicuculline exposure, recurrent synchronous bursting was inducible and persisted during the first 2 h in a manner similar to that of control networks. Thereafter, the bursting activity of actinomycin D-pre-treated networks decayed rapidly. Indices of bursting activity in hippocampal networks treated with actinomycin D 2 h after the bicuculline exposure were not statistically different from those of control networks not treated with actinomycin D (n=11). In an additional series of experiments hippocampal networks treated with actinomycin D 2 h after the bicuculline exposure were analysed for a period of 8 h following bicuculline stimulation; no statistical differences in the indices of bursting activity were found when compared with bicuculline-treated control networks (n= 9) (data not shown). C and D, analysis of the effects of the protein synthesis inhibitor anisomycin (10 μg ml−1) on hippocampal network plasticity. The percentage of spikes within bursts (C) and the number of bursts per minute (D) are shown. Anisomycin was added to the cultures 15 min prior to stimulation with bicuculline (n= 7). Compared with actinomycin D treatment, blockade of protein synthesis caused a much more rapid decay of recurrent synchronous bursting. The network returned to a pre-stimulation activity pattern within 30 min of bicuculline washout. To rule out the possibility that toxic effects of actinomycin D and anisomycin interfere with the ability of the network to generate bursts, 50 μm bicuculline was added a second time at the end of each experiment (indicated as 2nd induction); this gave rise to synchronous bursting that was virtually identical to that obtained during the first stimulation. For each time point, cultures treated with actinomycin D or anisomycin, respectively, were compared with controls with an independent samples t test. *P < 0.01, **P < 0.001, ***P < 0.0001.

References

    1. Abegg MH, Savic N, Ehrengruber R, McKinney RA, Gähwiler BH. Epileptiform activity in rat hippocampus strengthens excitatory synapses. J Physiol. 2003;554:439–448. - PMC - PubMed
    1. Alarcon JM, Malleret G, Touzani K, Vronskaya S, Ishii S, Kandel ER, Barco A. Chromatin acetylation, memory, and LTP are impaired in CBP+/– mice: a model for the cognitive deficit in Rubinstein–Taybi syndrome and its amelioration. Neuron. 2004;42:947–959. - PubMed
    1. Antonova I, Arancio O, Trillat AC, Wang HG, Zablow L, Udo H, Kandel ER, Hawkins RD. Rapid increase in clusters of presynaptic proteins at onset of long-lasting potentiation. Science. 2001;294:1547–1550. - PubMed
    1. Bacci A, Verderio C, Pravettoni E, Matteoli M. Synaptic and intrinsic mechanisms shape synchronous oscillations in hippocampal neurons in culture. Eur J Neurosci. 1999;11:389–397. - PubMed
    1. Bading H. Transcription-dependent neuronal plasticity: The nuclear calcium hypothesis. Eur J Biochem. 2000;267:5280–5283. - PubMed

Publication types

MeSH terms