

The rate of DNA evolution: effects of body size and temperature on the molecular clock
- PMID: 15618408
- PMCID: PMC544068
- DOI: 10.1073/pnas.0407735101
The rate of DNA evolution: effects of body size and temperature on the molecular clock
Abstract
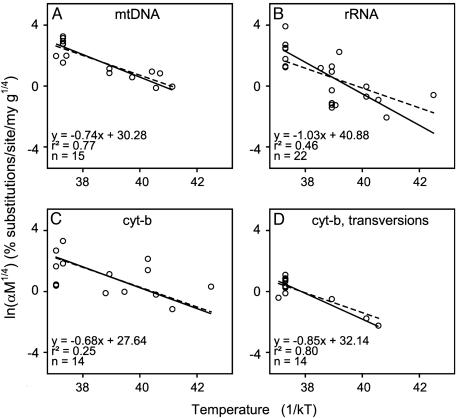
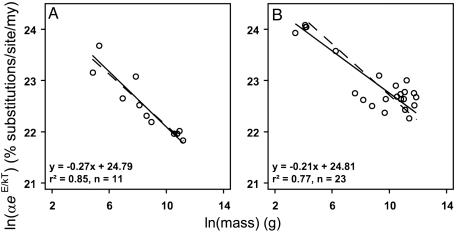
Observations that rates of molecular evolution vary widely within and among lineages have cast doubts on the existence of a single "molecular clock." Differences in the timing of evolutionary events estimated from genetic and fossil evidence have raised further questions about the accuracy of molecular clocks. Here, we present a model of nucleotide substitution that combines theory on metabolic rate with the now-classic neutral theory of molecular evolution. The model quantitatively predicts rate heterogeneity and may reconcile differences in molecular- and fossil-estimated dates of evolutionary events. Model predictions are supported by extensive data from mitochondrial and nuclear genomes. By accounting for the effects of body size and temperature on metabolic rate, this model explains heterogeneity in rates of nucleotide substitution in different genes, taxa, and thermal environments. This model also suggests that there is indeed a single molecular clock, as originally proposed by Zuckerkandl and Pauling [Zuckerkandl, E. & Pauling, L. (1965) in Evolving Genes and Proteins, eds. Bryson, V. & Vogel, H. J. (Academic, New York), pp. 97-166], but that it "ticks" at a constant substitution rate per unit of mass-specific metabolic energy rather than per unit of time. This model therefore links energy flux and genetic change. More generally, the model suggests that body size and temperature combine to control the overall rate of evolution through their effects on metabolism.
Figures


Comment in
-
Molecular clocks: the heavy, the cold, and the slow.Heredity (Edinb). 2005 Aug;95(2):115. doi: 10.1038/sj.hdy.6800681. Heredity (Edinb). 2005. PMID: 15931251 No abstract available.
References
-
- Zuckerkandl, E. & Pauling, L. (1965) in Evolving Genes and Proteins, eds. Bryson, V. & Vogel, H. J. (Academic, New York), pp. 97-166. - PubMed
-
- Alroy, J. (1999) Syst. Biol. 48, 107-118. - PubMed
-
- Smith, A. B. & Peterson, K. J. (2002) Annu. Rev. Earth Planetary Sci. 30, 65-88.
-
- Wray, G. A., Levinton, J. S. & Shapiro, L. H. (1996) Science 274, 568-573.
Publication types
MeSH terms
Substances
LinkOut - more resources
Full Text Sources
Other Literature Sources
Miscellaneous
