. 2005 Jan;137(1):209-19.
doi: 10.1104/pp.104.053082. Epub 2004 Dec 23.

Generation of active pools of abscisic acid revealed by in vivo imaging of water-stressed Arabidopsis

Affiliations

Generation of active pools of abscisic acid revealed by in vivo imaging of water-stressed Arabidopsis

Alexander Christmann et al. Plant Physiol. 2005 Jan.

Abstract

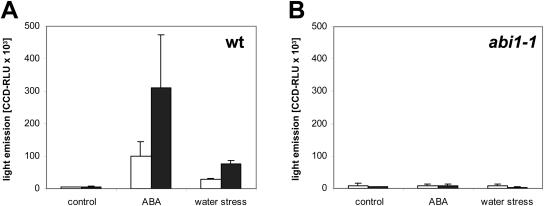
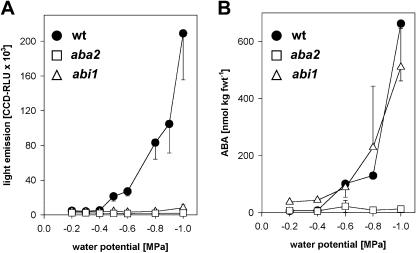
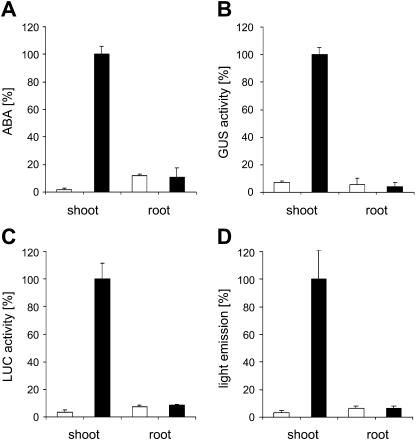
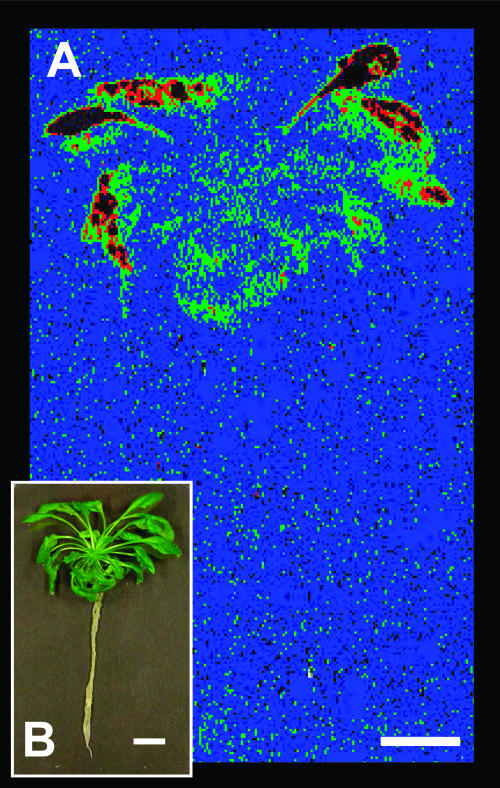
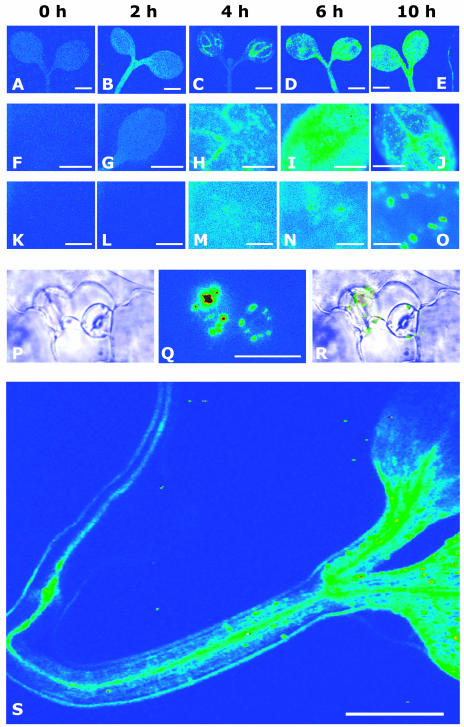
A noninvasive, cell-autonomous reporter system was developed to monitor the generation and distribution of physiologically active pools of abscisic acid (ABA). ABA response (abi1-1) and biosynthesis (aba2-1) mutants of Arabidopsis (Arabidopsis thaliana) were used to validate the system in the presence and absence of water stress. In the absence of water stress, low levels of ABA-dependent reporter activation were observed in the columella cells and quiescent center of the root as well as in the vascular tissues and stomata of cotyledons, suggesting a nonstress-related role for ABA in these cell types. Exposure of seedlings to exogenous ABA resulted in a uniform pattern of reporter expression. In marked contrast, reporter expression in response to drought stress was predominantly confined to the vasculature and stomata. Surprisingly, water stress applied to the root system resulted in the generation of ABA pools in the shoot but not in the root. The analysis of the response dynamics revealed a spread of physiologically active ABA from the vascular tissue into the areoles of the cotyledons. Later, ABA preferentially activated gene expression in guard cells. The primary sites of ABA action identified by in planta imaging corresponded to the sites of ABA biosynthesis, i.e. guard cells and cells associated with vascular veins. Hence, water stress recognized by the root system predominantly results in shoot-localized ABA action that culminates in a focused response in guard cells.


Figures

Figure 1.
Figure 1.
Dependence of reporter response on exogenous ABA levels. LUC expression of 4-d-old pAtHB6::LUC seedlings was recorded after exposure to various ABA concentrations for 12 h. Light emission of cotyledons (A) and roots (B) in wild-type (black circles), ABA-deficient aba2-1 (white squares), and ABA-insensitive abi1-1 (white triangles) background. ABA restores the reporter response in the ABA-deficient aba2-1 mutant, whereas the response is abrogated in the abi1-1 background. Note the different saturation levels of wild-type cotyledons and roots. When related to the protein content of the samples, the saturation levels became similar for shoots and roots. Values are means of 3 independent measurements, each comprising 15 seedlings.
Figure 2.
Figure 2.
Activation of pRD29B::LUC and pATHB6::LUC by ABA and water stress. Seedlings expressing either the pRD29B::LUC or pAtHB6::LUC reporter gene were exposed to ABA (30 μm), water stressed (Ψ = −0.8 MPa), or not treated in the control for 24 h prior to measurement of reporter activity. The analysis was performed in ABI1 wild-type (wt; A) and abi1-1 background (B; n = 45). Activity is expressed as relative light units captured by the CCD camera within 10 min for pRD29B::LUC (white bars) and pAtHB6::LUC reporter (black bars).
Figure 3.
Figure 3.
Reporter response and ABA levels in dependence of water potential. LUC expression of 4-d-old pAtHB6::LUC seedlings was recorded 24 h after exposure to various water potentials calibrated by supplementing the solidified medium with mannitol. Light emission (A) and ABA (B) levels of shoots were recorded in wild-type (black circles), ABA-deficient aba2-1 (white squares), and ABA-insensitive abi1-1 (white triangles) background. Values are means of 3 independent measurements, each comprising 15 seedlings.
Figure 4.
Figure 4.
Differential activation of ABA signaling induced by water stress. Seedlings of the pAtHB6::LUC line were exposed to control conditions (A), ABA (100 μm; B), and water stress (Ψ = −0.8 MPa; C) for 24 h prior to measurement of reporter activity. Luminescence intensity is depicted in false colors ranging from blue to red, indicating low and high intensity, respectively. In A, the scale of light emission is 5× enhanced compared to B and C. The nonenhanced image is shown as the inset. The seedling analyzed in B was deficient in ABA biosynthesis due to the aba2-1 mutation. The signals induced by water stress (C) are primarily confined to the stomata and vasculature of the cotyledons. The signal of the root and hypocotyl was hardly detectable. The pictures were taken by a CCD camera mounted to an inverted microscope with 2.5× magnification of the objective and an exposure time of 10 min with 4 × 4 pixel binning. The scale bars correspond to 1 mm.
Figure 5.
Figure 5.
ABA signaling in the root tip: response specificity toward ABA. Seedlings containing the pRD29B::GUS expression cassette were either nontreated or exposed to 30 μm ABA (ABA) or their roots were water stressed (stress; Ψ = −1.0 MPa) for 24 h prior to histological staining for reporter activity. The analysis included seedlings with wild-type ABA response (wt), ABA deficiency, and ABA insensitivity provided by the aba2 and abi1 mutant background, respectively. The pictures arranged in a vertical row represent photographs of the same specimen with one specific treatment, while the horizontal rows represent photographs of the same organ or organ parts of seedlings treated differently. The first horizontal row (A–E) shows a close-up view of the cotyledon (scale bars represent 100 μm), the second the shoot (scale bars represent 1 mm), the third a section of the root (scale bars represent 100 μm), and the fourth the root tip (scale bars represent 100 μm). The specimens were stained for identical periods (1 h) to visualize reporter activity, with the exception of Figure 5, K, N, and O, which were stained for 3 h.
Figure 6.
Figure 6.
Induction of ABA pools and ABA signaling in shoots by water-stressing roots. Seedlings of lines pRD29B::LUC and pRD29B::GUS were exposed to water stress (Ψ = −0.8 MPa) via the roots for 24 h prior to the analysis of shoots and roots. The analysis included determination of ABA levels (A), GUS reporter activity (B), and LUC activity (C), with both reporters assayed enzymatically in tissue extracts, and light emission analyzed ratiometrically by in vivo measurement (D). The values are shown for water-stressed seedlings (black bars) and controls (white bars) of either the pRD29B::LUC (A, C, and D) or pRD29B::GUS (B) line. The values are given relative to the highest value obtained within one type of analysis for better comparison with 100% marking in 148 fmol ABA μg protein−1 (A; this equals 164 nmol ABA kg−1 shoot fresh weight or 435 nmol ABA kg−1 root fresh weight), 8.12 RLU s−1 μg protein−1 (B), 1,890 RLU s−1 μg protein−1 (C), and 31 CCD-RLU s−1 μg protein−1 (D). The analysis was performed on 3 groups of 15 seedlings per data point (± sd).
Figure 7.
Figure 7.
Reporter response in Arabidopsis rosette plant. The pAtHB6::LUC reporter plants cultivated for 4 weeks under sterile conditions were exposed to water stress (Ψ = −1.0 MPa) via their root system for 24 h prior to in vivo measurement of reporter activity shown in false colors (A) for a single plant and the corresponding brightfield image (B). Comparatively developed and nonstressed plants served as a control and revealed only background LUC activity, while p35S::LUC transgenic plants showed high reporter activity in root and shoot (not shown). Color code is as introduced in Figure 4. The scale bars correspond to 1 cm.
Figure 8.
Figure 8.
Dynamics of reporter response to root-sensed water stress. Seedlings of the reporter line pAtHB6::LUC were water stressed via their roots (Ψ = −1.0 MPa), and reporter activity was recorded noninvasively. The images depict light emission of cotyledons at different magnification and in dependence of time of water stress (0, 2, 4, 6, and 10 h). Background reporter activity (false color scale as before) is seen at the onset of the experiment (A, F, and K). The signal increases roughly 2-fold after 2 h, but no distinct pattern of reporter activation can be recognized (B, G, and L). Four hours after the beginning of stress exposure, the reporter is significantly induced in vascular tissues of the cotyledons (C and H), whereas after 2 additional h of treatment, a more generalized response is seen throughout the shoot (D, I, and N). After 10 h of water stress, reporter induction focused within vascular tissues (J) and guard cells (J, O–R). Reporter induction was also visible in the root (E; root positioned on the right) at that time point. However, no reporter induction was detected in the roots before. A similar pattern of ABA action is seen after 14 h of water stress (S). A to E, Pattern of light emission from representative shoots; objective 2.5×; bars correspond to 1 mm. F to J, Light emission from a representative cotyledon during water stress; objective 10×; bars correspond to 500 μm. K to O, Light emission from epidermal cells and guard cells during water stress; objective 40×; bars correspond to 100 μm. P to R, Light emission from guard cells after 10 h of water stress; objective 40×; bars correspond to 100 μm. P, Brightfield picture. Q, Pattern of light emission. R, Overlay picture of P and Q. S, Light emission from a seedling after 14 h of water stress treatment; objective 2.5×; exposure time 15 min; pixel binning 4 × 4; bar corresponds to 1 mm.

References

    1. Benkova E, Michniewicz M, Sauer M, Teichmann T, Seifertova D, Jurgens G, Friml J (2003) Local, efflux-dependent auxin gradients as a common module for plant organ formation. Cell 115: 591–602 - PubMed
    1. Breyne P, De Loose M, Dedonder A, Van Montagu M, Depicker A (1993) Quantitative analysis of β-glucuronidase activities using a computer-directed microtiter plate reader. Plant Mol Biol Rep 11: 21–31
    1. Casimiro I, Beeckman T, Graham N, Bhalerao R, Zhang H, Casero P, Sandberg G, Bennett MJ (2003) Dissecting Arabidopsis lateral root development. Trends Plant Sci 8: 165–171 - PubMed
    1. Cheng WH, Endo A, Zhou L, Penney J, Chen HC, Arroyo A, Leon P, Nambara E, Asami T, Seo M, et al (2002) A unique short-chain dehydrogenase/reductase in Arabidopsis glucose signaling and abscisic acid biosynthesis and functions. Plant Cell 14: 2723–2743 - PMC - PubMed
    1. Chinnusamy V, Stevenson B, Lee BH, Zhu JK (2002) Screening for gene regulation mutants by bioluminescence imaging. Sci STKE 140: PL10 - PubMed

Publication types