Comparative Study
. 2005 Jan;125(1):81-101.
doi: 10.1085/jgp.200409124.

Acute ENaC stimulation by cAMP in a kidney cell line is mediated by exocytic insertion from a recycling channel pool

Affiliations
Comparative Study

Acute ENaC stimulation by cAMP in a kidney cell line is mediated by exocytic insertion from a recycling channel pool

Michael B Butterworth et al. J Gen Physiol. 2005 Jan.

Abstract

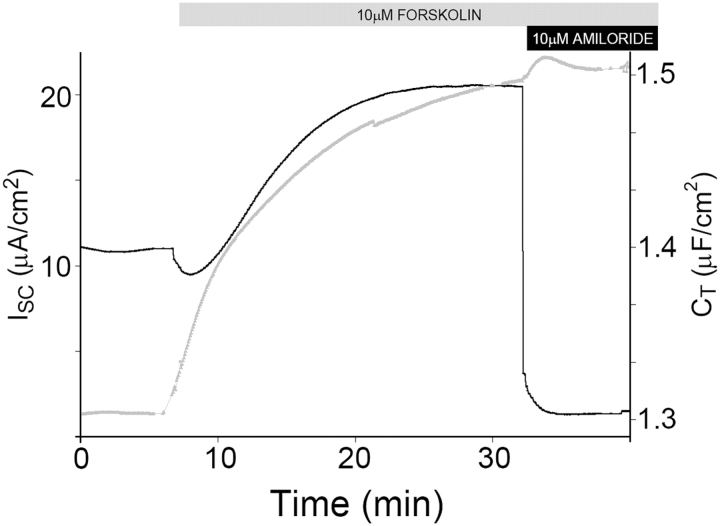
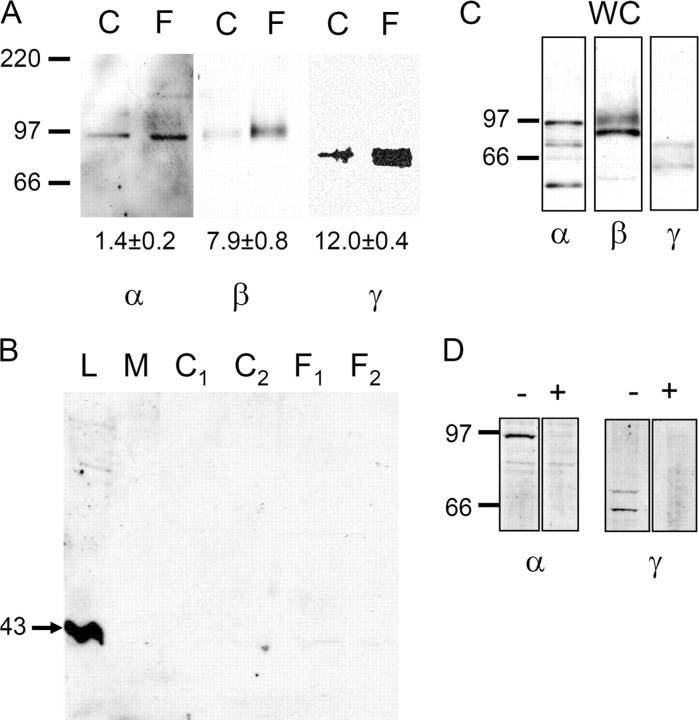
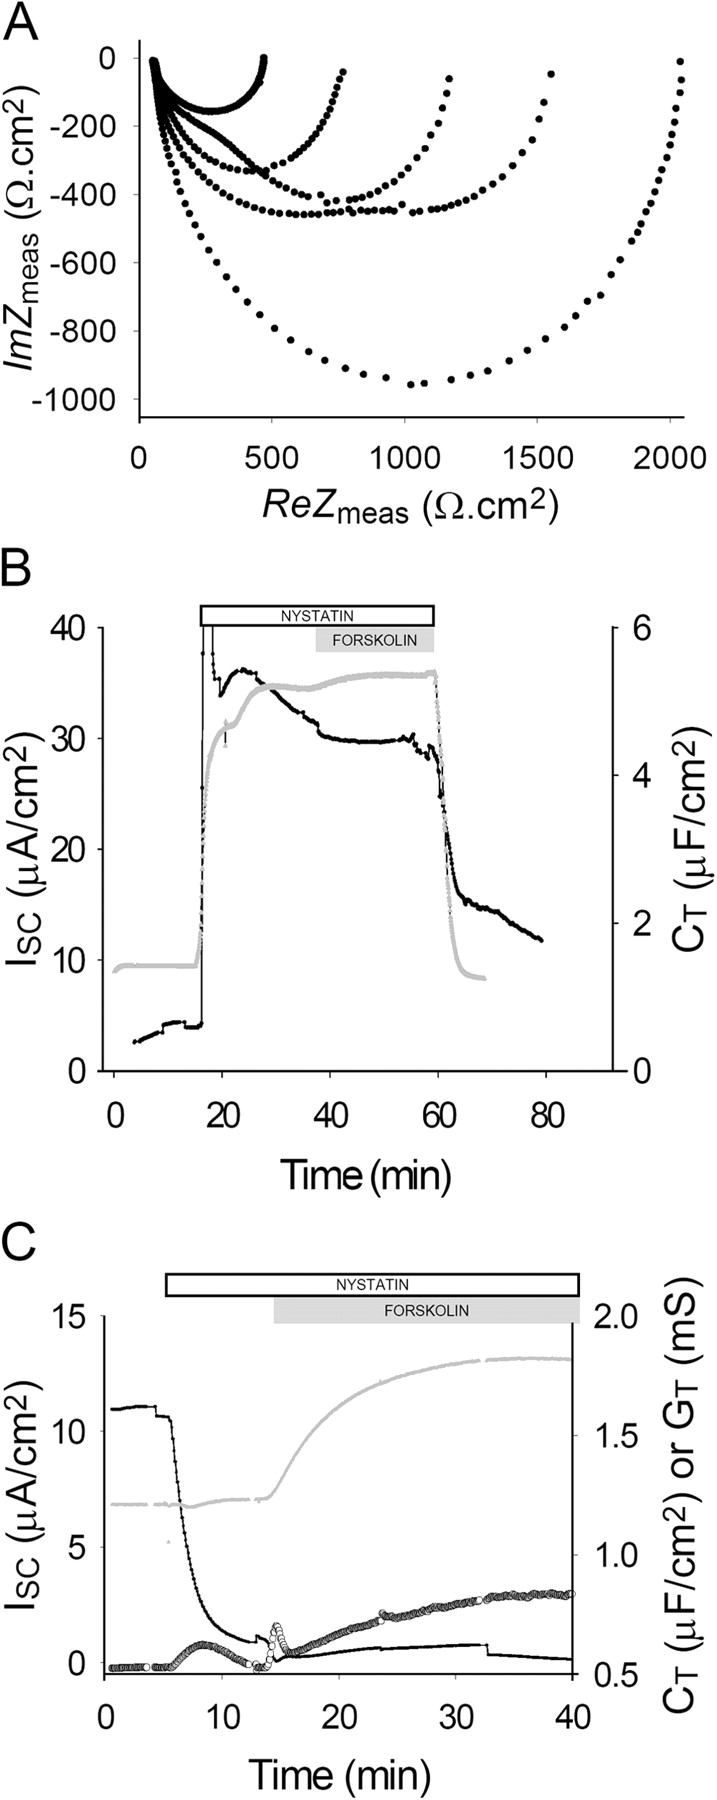
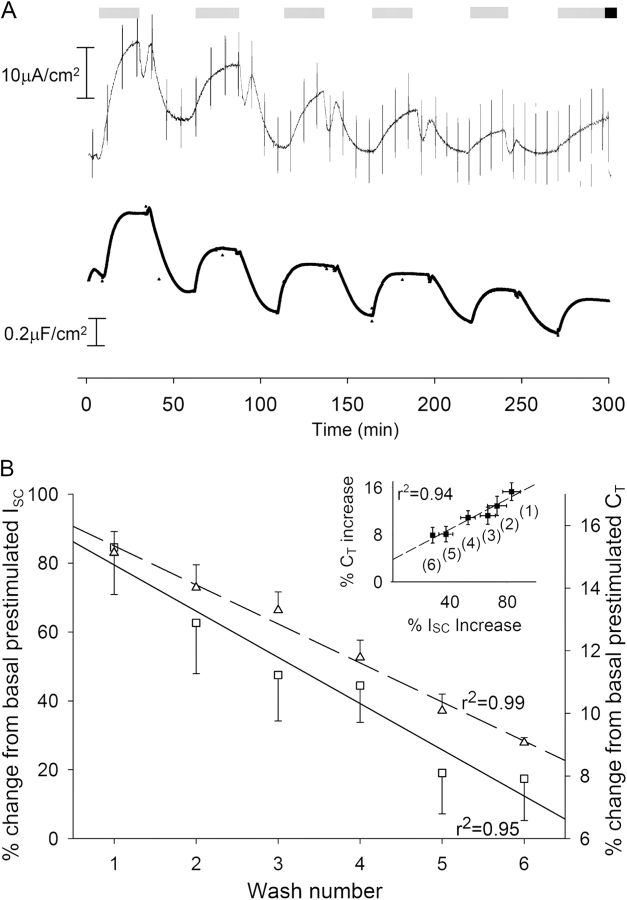
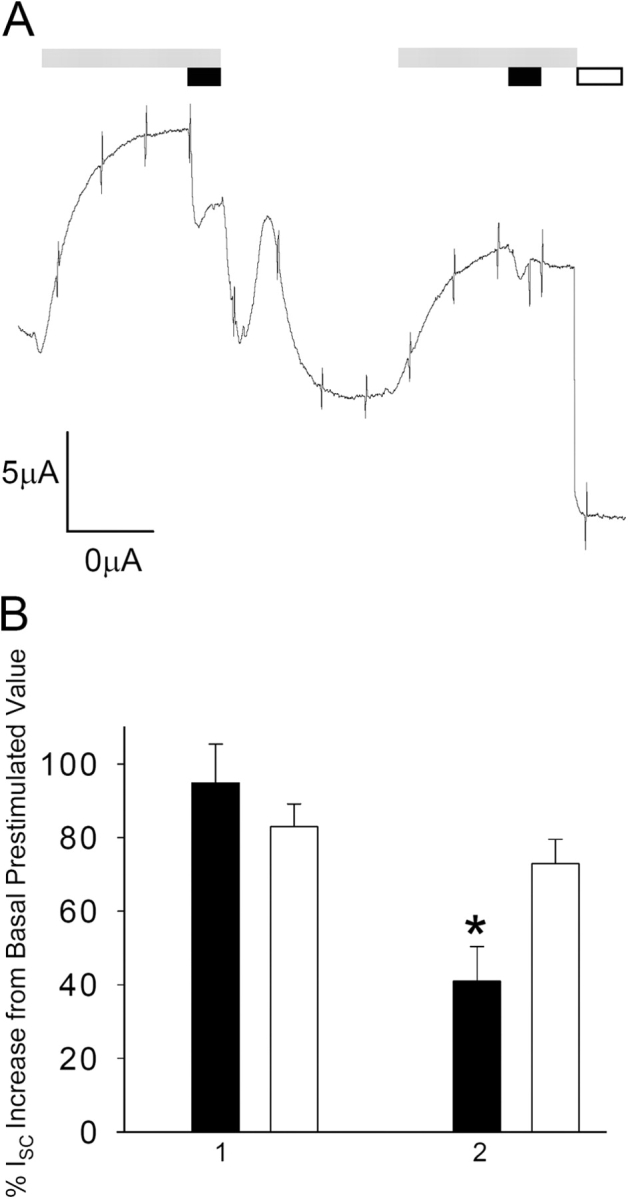
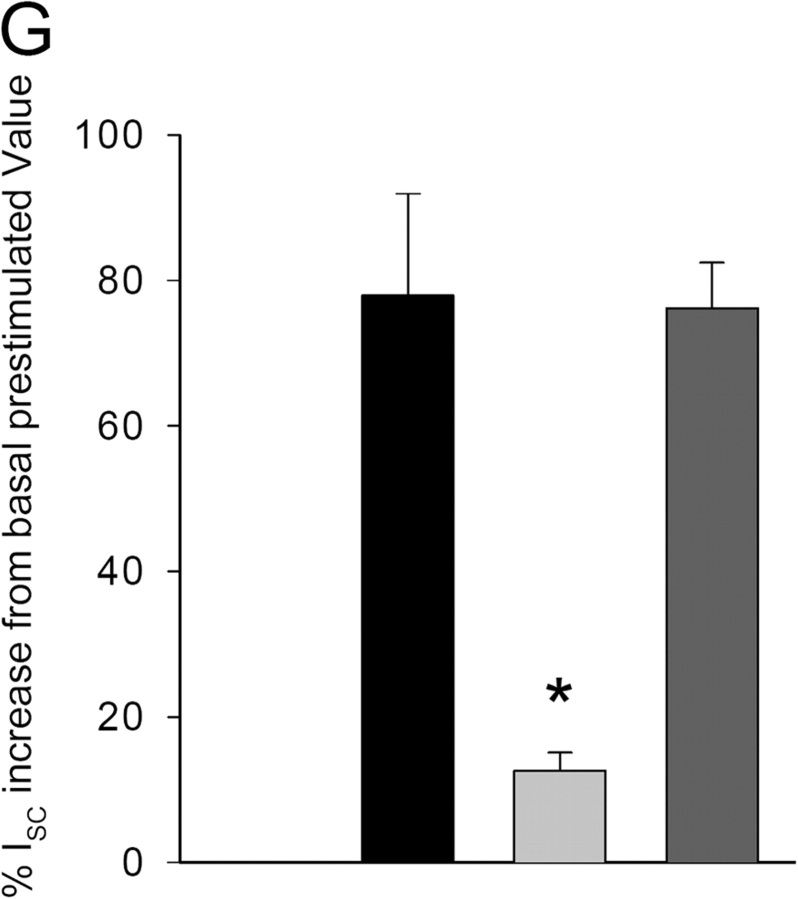
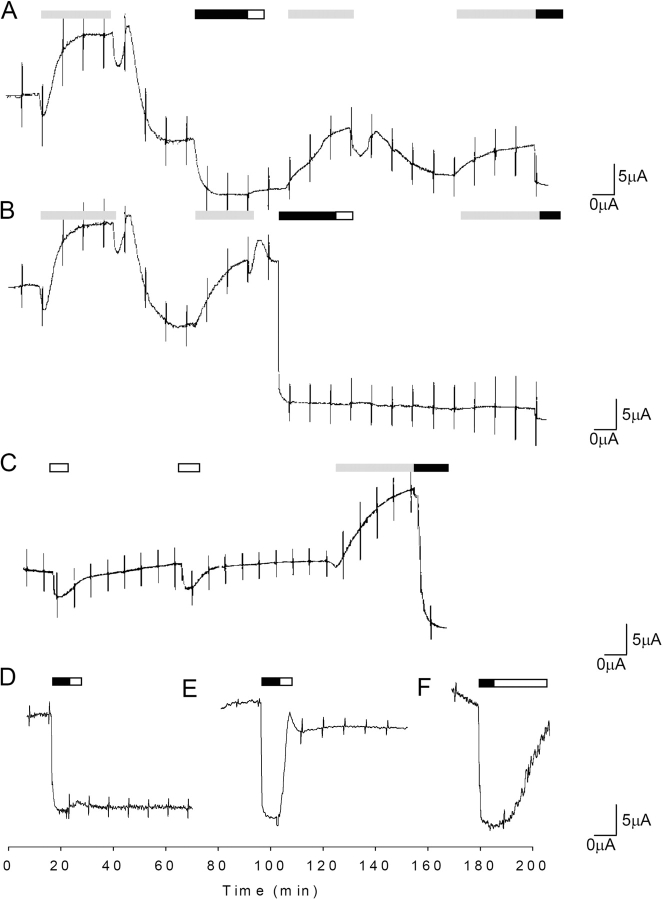
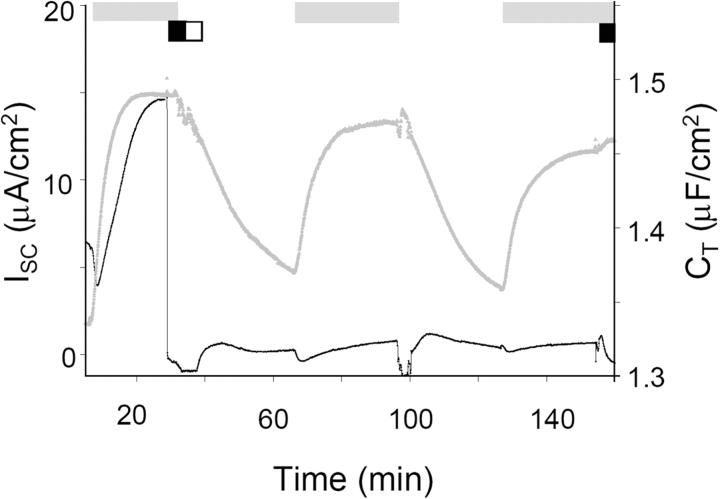
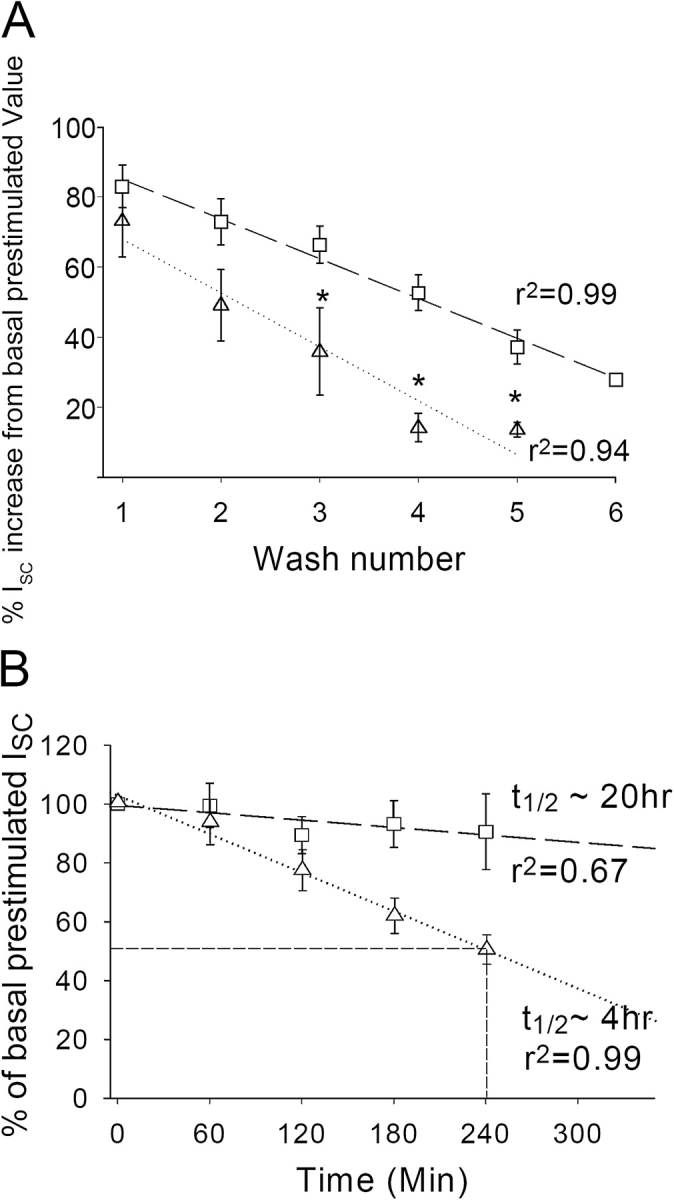
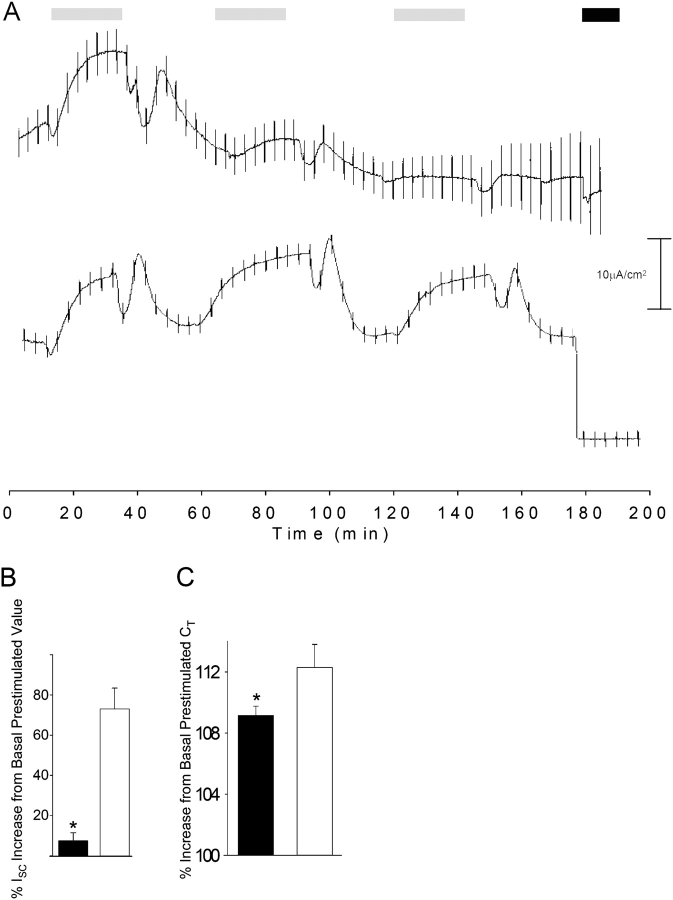
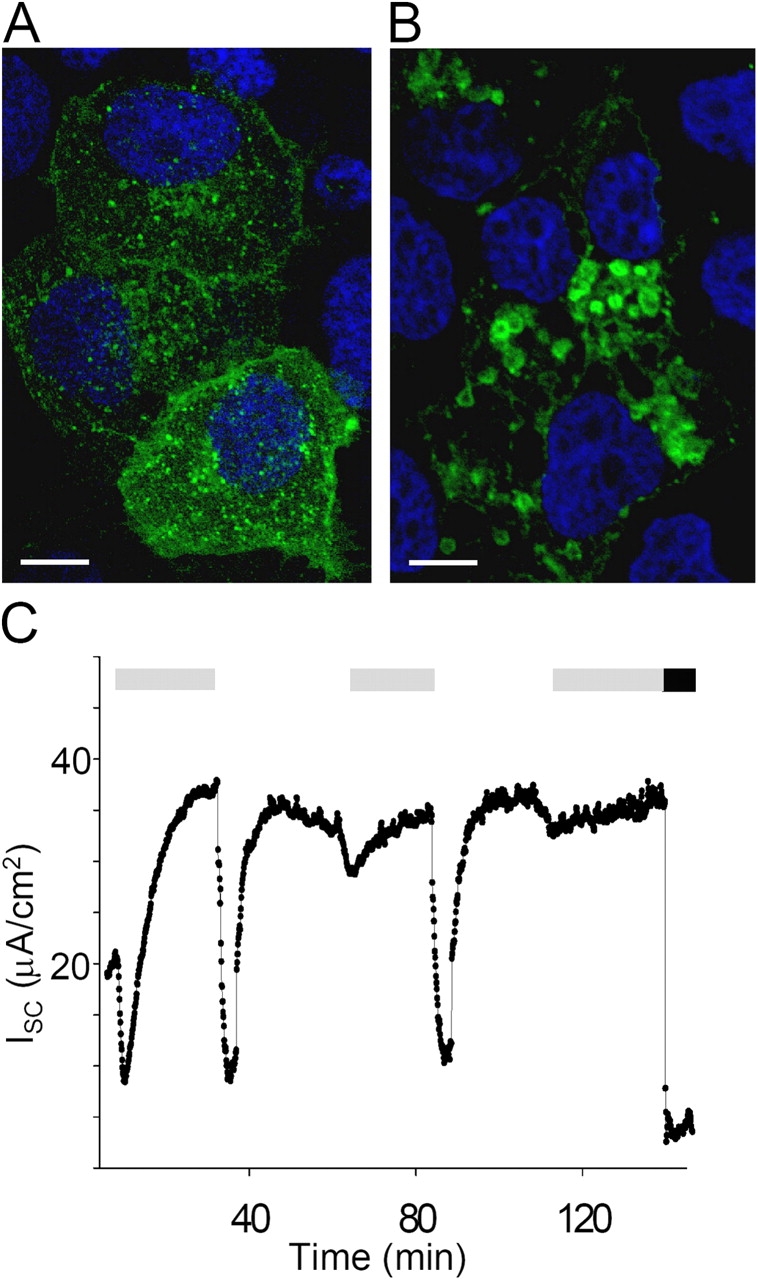
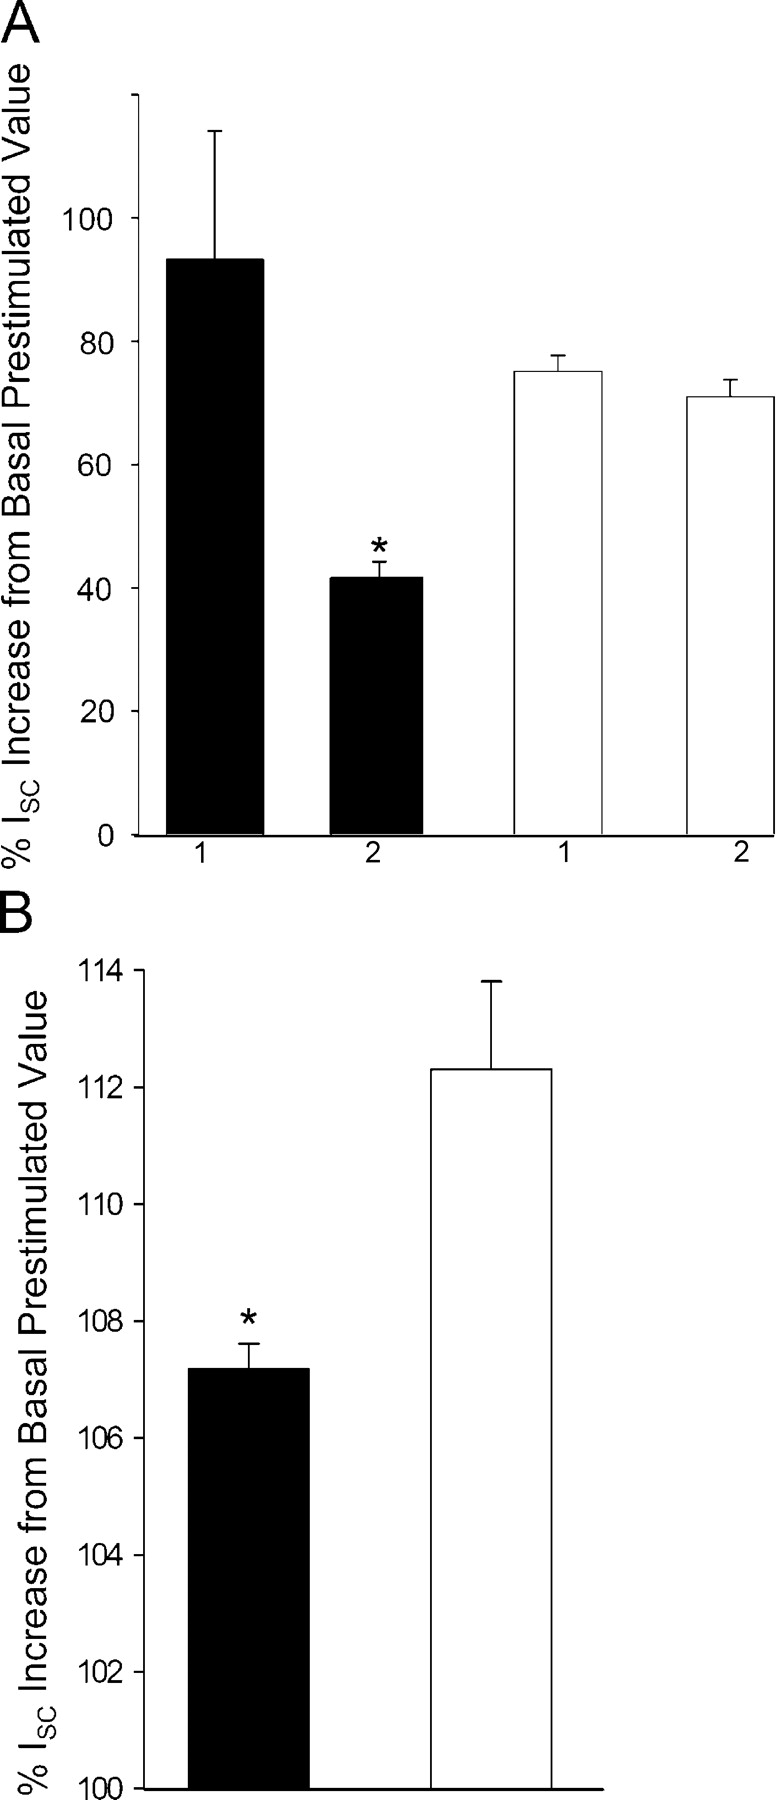
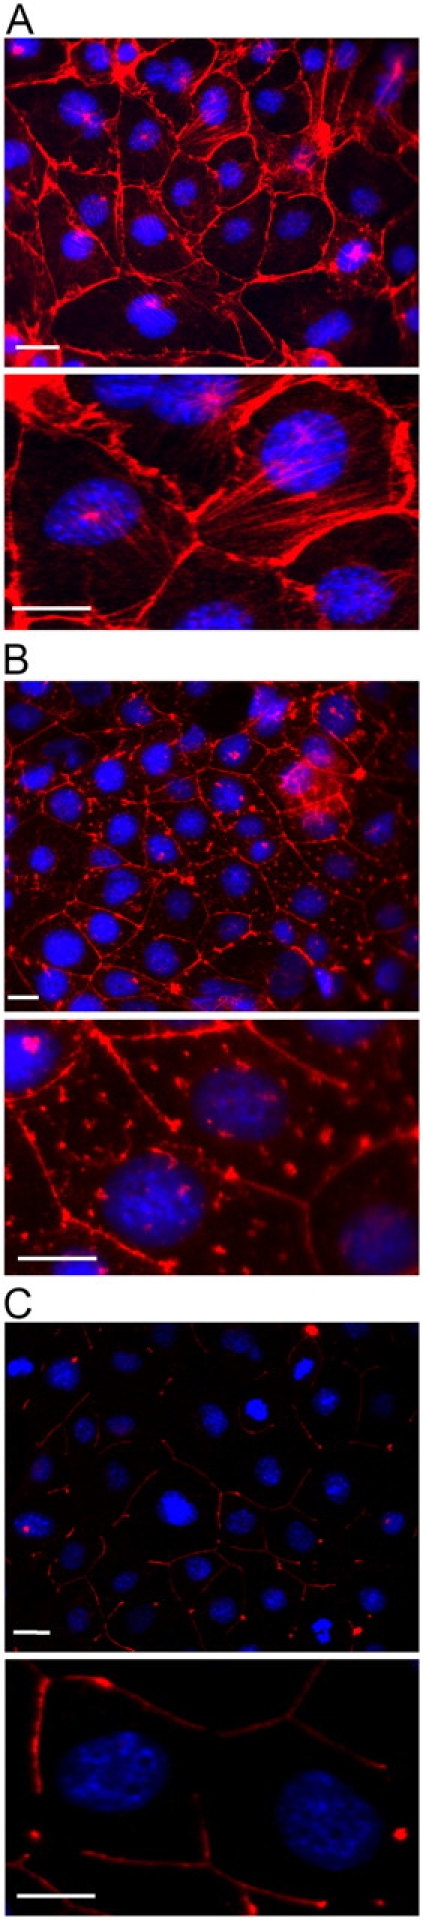
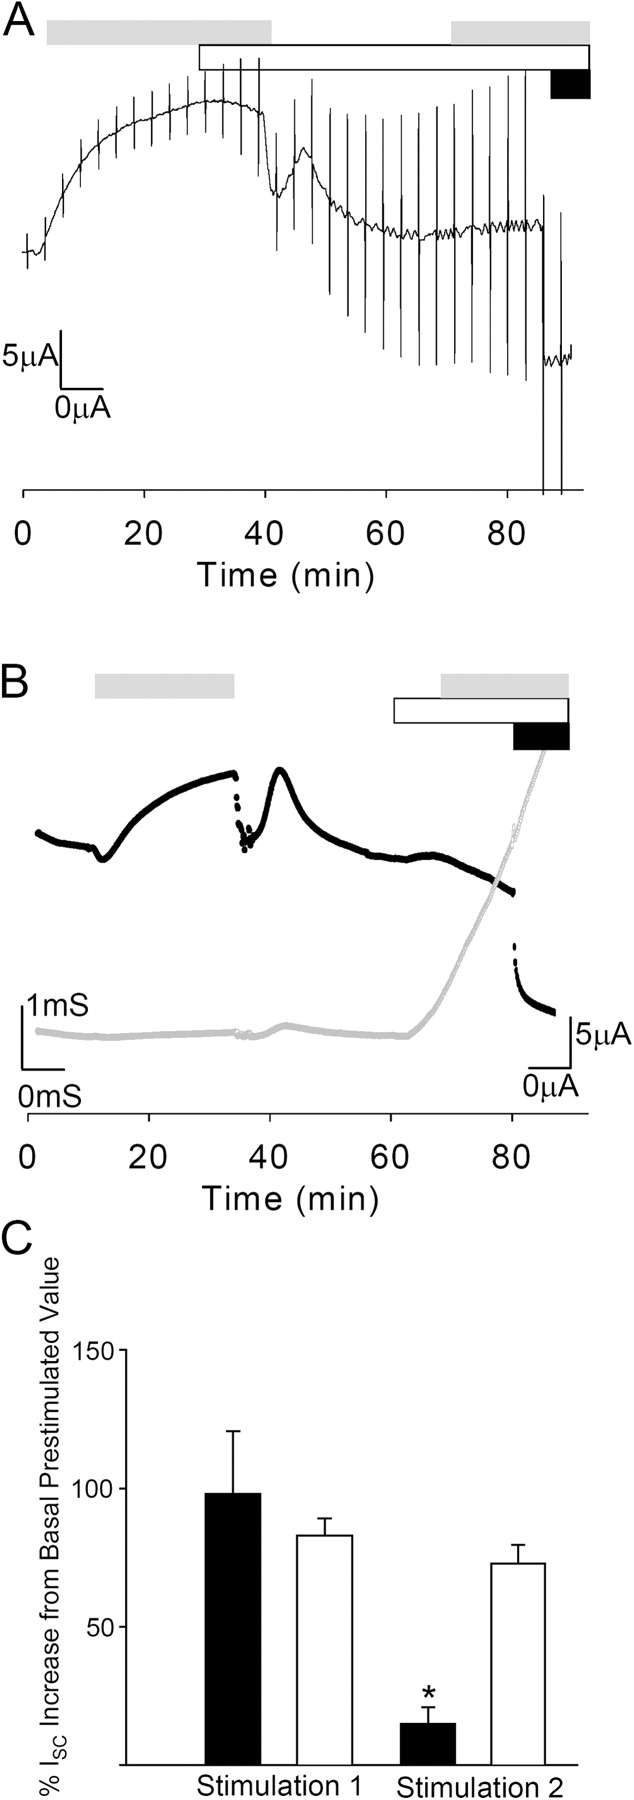
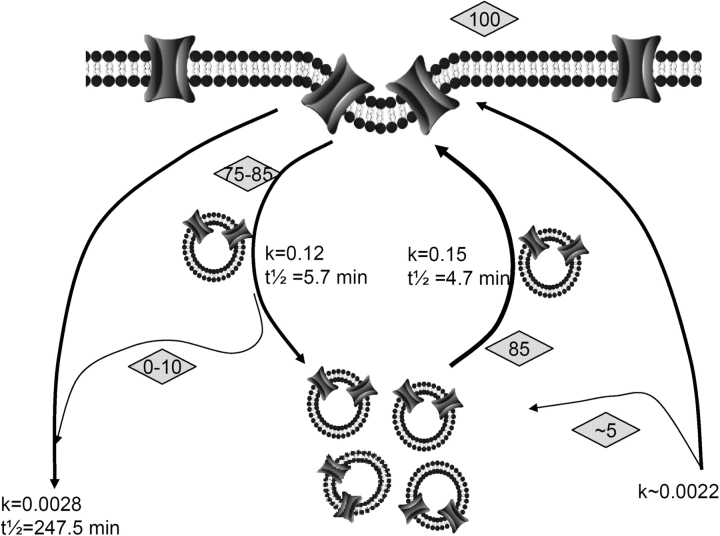
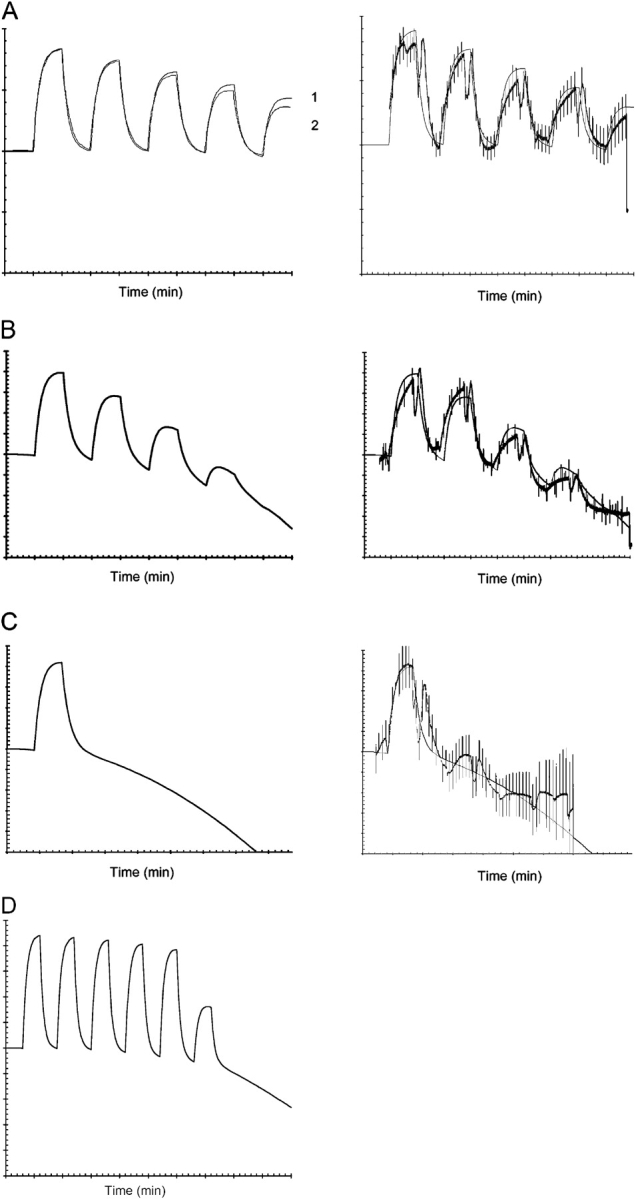
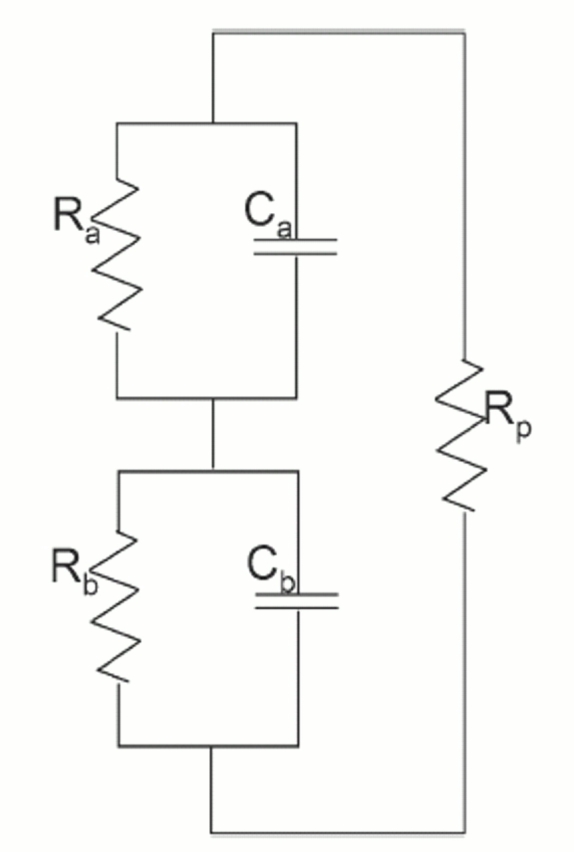
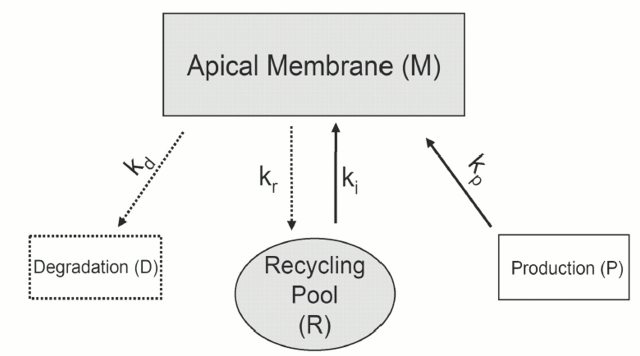
Acute hormonal regulation of the epithelial sodium channel (ENaC) in tight epithelia increases transcellular Na(+) transport via trafficking of intracellular channels to the apical surface. The fate of the channels removed from the apical surface following agonist washout is less clear. By repetitively stimulating polarized mouse cortical collecting duct (mCCD, (MPK)CCD(14)) epithelia, we evaluated the hypothesis that ENaC recycles through an intracellular pool to be available for reinsertion into the apical membrane. Short circuit current (I(SC)), membrane capacitance (C(T)), and conductance (G(T)) were recorded from mCCD epithelia mounted in modified Ussing chambers. Surface biotinylation of ENaC demonstrated an increase in channel number in the apical membrane following cAMP stimulation. This increase was accompanied by a 83 +/- 6% (n = 31) increase in I(SC) and a 15.3 +/- 1.5% (n = 15) increase in C(T). Selective membrane permeabilization demonstrated that the C(T) increase was due to an increase in apical membrane capacitance. I(SC) and C(T) declined to basal levels on stimulus washout. Repetitive cAMP stimulation and washout (approximately 1 h each cycle) resulted in response fatigue; DeltaI(SC) decreased approximately 10% per stimulation-recovery cycle. When channel production was blocked by cycloheximide, DeltaI(SC) decreased approximately 15% per stimulation cycle, indicating that newly synthesized ENaC contributed a relatively small fraction of the channels mobilized to the apical membrane. Selective block of surface ENaC by benzamil demonstrated that channels inserted from a subapical pool made up >90% of the stimulated I(SC), and that on restimulation a large proportion of channels retrieved from the apical surface were reinserted into the apical membrane. Channel recycling was disrupted by brefeldin A, which inhibited ENaC exocytosis, by chloroquine, which inhibited ENaC endocytosis and recycling, and by latrunculin A, which blocked ENaC exocytosis. A compartment model featuring channel populations in the apical membrane and intracellular recycling pool provided an adequate kinetic description of the I(SC) responses to repetitive stimulation. The model supports the concept of ENaC recycling in response to repetitive cAMP stimulation.


Figures

F<sc>igure</sc> 1.
Figure 1.
mCCD epithelia response to forskolin. (A) Typical ISC and CT responses to 10 μM basolateral forskolin addition. Amiloride (10 μM) added apically at the ISC peak demonstrated that >90% of recorded ISC was INa and had little effect on recorded CT.
F<sc>igure</sc> 2.
Figure 2.
Apical surface biotinylation. (A) Forskolin stimulation (30 min) resulted in increased ENaC available for biotinylation at the apical surface as observed in subsequent Western blots from paired CCD epithelia. C = control unstimulated, F = 10 μM forskolin stimulated. Densiometric quantitation of the fold increase in surface labeling is presented beneath each blot for α-, β-, and γ-ENaC subunits (n = 3). (B) Actin control for biotinylated samples demonstrates that no observable signal can be detected in control (two separate samples C1 and C2) or forskolin-stimulated (F1 and F2) biotinylated samples (L = whole cell lysate as positive control, M = lane for molecular weight standards). (C) Western blot for whole cell lysate obtained from control mCCD epithelia cultured on filter supports. (D) Western blot of peptide competition controls for anti α- and γ-ENaC antisera demonstrate specific resolved bands in the absence of immunizing peptide (−) are competed when antisera was incubated with the immunizing peptide (+).
F<sc>igure</sc> 3.
Figure 3.
Membrane permeabilization. (A) Nyquist plots from a CCD epithelium to which increasing concentrations of apical nystatin was added. From an unpermeabilized state, a single impedance locus (one semicircle) transitioned through two loci until only one locus corresponding to the basolateral membrane was observed (at 100 μM nystatin). (B) Time course of ISC (black) and CT (gray) plots in response to apical nystatin addition (white bar). Small changes in recorded basolateral capacitance with forskolin (gray bar) were insufficient to account for observed ΔCT changes. (C) A similar plot (as in B) for basolateral permeabilization exhibits a CT response to 10 μM basolateral forskolin addition similar to unpermeabilized epithelia. ISC decreased due to removal of transepithelial driving force. Small drift in GT (open circles) indicates that transepithelial resistance remained fairly constant.
F<sc>igure</sc> 4.
Figure 4.
Repetitive stimulation and ΔISC rundown. (A) Time course of ISC and CT plot with repeated basolateral forskolin (gray bar) stimulation and washout. Note the artifact in ISC where forskolin is washed from the basolateral chamber (see Fig. 6 C). (B) Decline in forskolin response (ISC, ▵; CT, □) as a percentage of basal values. Fitted linear regression (with associated r2 value) is plotted for each parameter (n = 6–31 for each data point). Inset graph plots ΔCT vs. ΔISC as percentage change for each stimulation (parenthesis), indicating that declines in ISC and CT are correlated.
F<sc>igure</sc> 5.
Figure 5.
NiCl2 block of ISC. (A) A representative ISC trace demonstrates that the addition of 20 mM NiCl2 (black bar) to the apical bathing solution at the peak of the 10 μM forskolin stimulation (gray bar) results in an irreversible inhibition of ENaC current (note no recovery of current on washout of NiCl2). Following stimulus washout, restimulated ISC response is significantly reduced and a second NiCl2 addition (black bar) fails to inhibit the previously blocked ENaC. (white bar, addition of 10 μM amiloride). (B) A normalized summary of six experiments performed in the same manner as A demonstrates that initial (1 = first stimulation) unblocked response (black bar) to forskolin stimulation is not significantly different from control experiments (white bar). Following irreversible ENaC block by NiCl2 (black bar), a subsequent stimulation (2 = second stimulation) is significantly smaller when compared with control epithelia (white bar).
F<sc>igure</sc> 6.
Figure 6.
Benzamil block of ISC. (A) INa was blocked by 10 μM benzamil (black bar), which was added to the apical chamber after currents had returned to baseline following an initial forskolin (gray bar) stimulation (basal ISC block). Following an extensive apical wash (white bar), basolateral forskolin addition (gray bar) stimulated ISC, indicating ENaC insertion from a pool inaccessible to block by apical benzamil addition. (B) Cells were subject to two rounds of forskolin stimulation (gray bar). Benzamil (black bar) was added at the ISC peak of the second forskolin stimulation to block all channels present in the apical surface including those delivered by vesicle insertion. Both benzamil and forskolin were washed out and cells were restimulated after sufficient time had elapsed to ensure channel retrieval had occurred (see timing for multiple stimulation in Fig. 4). No additional ISC stimulation was noted following a third forskolin addition. (C) Control epithelium received two sham washes (white bar), illustrating the ISC wash artifact, followed by forskolin stimulation (gray bar) at 120 min. (D) Benzamil addition (black bar) to basal current inhibited INa, which did not recover significantly following an apical wash (white bar) using the same fluid volume as for washes performed in A and B. (E) Basal current was blocked by apical addition of 10 μM amiloride (black bar). ISC was restored close to baseline values following apical wash using the same fluid volume as for washes in A and B, indicating that this blocker was more readily reversible than benzamil. (F) ISC was blocked by 10 μM apical benzamil addition (black bar). The apical chamber was then washed continuously until baseline current had been restored (white bar) after >15 min of fluid exchange, indicating that benzamil was a poorly reversible blocker in this experimental setup. (G) Summary of ΔISC percent increase from basal currents for five experiments performed in the same way as either A or B. Epithelia in which current was blocked before stimulation (black bar) responded by increasing current by 7.05 ± 3.8 μA/cm2, which was not statistically different from the 9.2 ± 1.0 μA/cm2 increase in control cells (dark gray bar) (n = 30). When benzamil was added at the peak of the forskolin response (light gray bar) and cells were restimulated, the current increase of 0.9 ± 0.5 μA/cm2 was significantly lower than controls (*, P < 0.05).
F<sc>igure</sc> 7.
Figure 7.
Capacitance response in the presence of benzamil. Simultaneous ISC (black trace) and CT (gray trace) recordings illustrate that the reduced forskolin response was not due to a failure to insert membrane, as CT changes with repetitive stimulation were unaffected (forskolin and benzamil addition indicated by bars as in Fig. 6 A).
F<sc>igure</sc> 8.
Figure 8.
CHX effects on ISC. (A) ΔISC decay with rounds of stimulation plotted for control (□) and CHX-treated (▵) epithelia (n > 4). Fitted regression slopes indicated a loss in response of 11.3% and 15.4% for control and CHX epithelia, respectively (*, P< 0.05). (B) The decline in basal current over time is plotted for control (□) and CHX-treated (▵) epithelia. Fitted linear regression and t1/2 presented for each curve. Points are mean and SEM (n ≥ 4).
F<sc>igure</sc> 9.
Figure 9.
BFA treatment. (A) Representative trace demonstrating the effect of 5 μg/ml BFA on ISC response (upper trace) to repetitive stimulations with the lower trace from control untreated epithelium from the same batch, age, and passage. (B) Summary of percentage ISC increase a second forskolin stimulus elicited in BFA (n = 8) treated (black bar) compared with control (gray bar) epithelia (n = 19) demonstrated that the current response to forskolin was significantly smaller than control. (C) Percent CT change for second forskolin stimulation in the presence of BFA (n = 3) (black bar) and control (gray bar) epithelia (n = 15; *, P < 0.05).
F<sc>igure</sc> 10.
Figure 10.
Chloroquine treatment. (A and B) Fluorescence micrographs from mCCD cells transiently expressing GFP-Endo to label endocytic compartments. Typical punctuate fluorescent staining pattern of endosomes (green) in untreated cells (A) collapsed to distended coalesced structures (B) in chloroquine-treated cells (white bar = 5 μm, nuclei labeled blue). (C) Representative ISC trace from chloroquine-treated epithelium with repeated forskolin stimulation (gray bar). Note large dips in trace are the result of extended wash protocol to ensure total removal of forskolin from basal chamber. Addition of amiloride (black bar) following the third stimulation demonstrated that the majority of recorded ISC was due to ENaC.
F<sc>igure</sc> 11.
Figure 11.
Chloroquine treatment summary. (A) Percentage ISC increase for two forskolin stimulations (1 and 2). Control epithelia (white bar) produced ∼80% increase in ISC for each stimulation with the previously noted decline in response with successive stimuli. The first ISC response for chloroquine-treated epithelia (black bar) was not statistically significantly different from control; however, ΔISC for the second stimulation was significantly reduced. (B) Percent CT increase from prestimulated value for second forskolin stimulation (number 2 in A) indicates that chloroquine-treated cells (black bar) had a significantly reduced response when compared with controls (n > 3; *, P < 0.05).
F<sc>igure</sc> 12.
Figure 12.
LatA. (A–C) Fluorescence micrographs of mCCD epithelia, phalloidin-labeled actin (red), and Hoechst-stained nuclei (blue). Untreated cells (A) exhibit typical cortical and filamentous actin staining that becomes progressively depolymerized with the addition of 200 nM (B) and 1 μM (C) LatA until most actin staining is lost. Areas of the micrographs are enlarged to show detail (white bar = 2 μm).
F<sc>igure</sc> 13.
Figure 13.
ISC and GT response to LatA. (A) Representative ISC trace demonstrates that forskolin- induced ISC stimulus (gray bar) returned to basal levels when LatA (white bar) was added at the peak of ISC response. Readdition of forskolin did not elicit a subsequent stimulation (note that periodic voltage pulses increased on addition of LatA, indicating a loss in transepithelial resistance, but cells could be voltage clamped for the duration of the experiment). Addition of 10 μM amiloride (black bar) at the end of the trace indicated that the majority of the ISC was INa. (B) Simultaneous ISC (black trace) and GT (gray trace) measurement demonstrated that the addition of LatA (white bar) after a round of forskolin stimulation and wash resulted in a loss in resistance (increase in conductance), but that the ISC was not stimulated by addition of forskolin (gray bar). The calculated resistance at the end of the trace was ∼200 Ω.cm2 but cells could still be voltage clamped and current was inhibited by amiloride (as in A). (C) Summary of five similar experiments to A present forskolin ISC responses to two rounds of stimulation (labeled 1 and 2) and indicate that LatA (black bars) significantly inhibited forskolin stimulation (second stimulation, 2) when compared with control epithelia (white bar).
F<sc>igure</sc> 14.
Figure 14.
Schematic model of ENaC recycling pathways. Rates (k) and t1/2 values as calculated from ISC measurements are provided for each pathway, and were used to model the recycling kinetics as described in the text (see Fig. 15). Values in shaded diamonds represent the relative pool sizes (percent of basal ISC, i.e., number of functional channels) derived from these pathways.
F<sc>igure</sc> 15.
Figure 15.
Model ISC predictions. (A) Trace 1 produced using measured ISC kinetics (see Fig. 14 for values) presented on the left panel. The model was altered to account for channel loss from the recycling pool (see text) and produced a more rapid ΔISC decline (trace 2), which better fit experimental recordings (right panel shows actual trace overlaid with curve 2 from modeled data). (B) The ISC trace describing CHX treatment (left) was obtained by blocking the production pathway on the model, which closely approximated actual recordings (right panel). (C) BFA treatment was modeled as a single stimulation event after which no additional channel insertion event was permitted (left) to simulate block of ENaC delivery to the cell surface. Actual ISC recordings overlaid on the model trace (right) show that some channel delivery still occurred following BFA treatment. (D) Trace from an alternative model, which includes a large intracellular channel pool. ENaC does not return to this pool following agonist washout. The predicted ISC trace does not resemble actual data from control epithelia (as in A) since ΔISC does not decline significantly with repetitive stimulations until the channel store is exhausted.
F<sc>igure</sc> A1.
Figure A1.
Model RC circuit. A schematic representation of the simple model circuit that represents a polarized epithelium used to calculate capacitance. Apical and basal membranes are described as a parallel resistor (Ra and Rb) and capacitor (Ca and Cb) connected in series. The paracellular resistance (Rp) is connected in parallel.
F<sc>igure</sc> A2.
Figure A2.
Schematic compartmental model. The arrangement of intracellular channel recycling pool and apical membrane used for modeling repetitive forskolin stimulations is presented in the schematic compartmental model. Associated rates for movement of channels between compartments is presented adjacent to arrows connecting compartments and these were used in equations described in the text to model trafficking events.

Similar articles

Cited by

References

    1. Abriel, H., J. Loffing, J.F. Rebhun, J.H. Pratt, L. Schild, J.D. Horisberger, D. Rotin, and O. Staub. 1999. Defective regulation of the epithelial Na+ channel by Nedd4 in Liddle's syndrome. J. Clin. Invest. 103:667–673. - PMC - PubMed
    1. Bachert, C., T.H. Lee, and A.D. Linstedt. 2001. Lumenal endosomal and Golgi-retrieval determinants involved in pH-sensitive targeting of an early Golgi protein. Mol. Biol. Cell. 12:3152–3160. - PMC - PubMed
    1. Benos, D.J., M.S. Awayda, I.I. Ismailov, and J.P. Johnson. 1995. Structure and function of amiloride-sensitive Na+ channels. J. Membr. Biol. 143:1–18. - PubMed
    1. Berdiev, B.K., R. Latorre, D.J. Benos, and I.I. Ismailov. 2001. Actin modifies Ca2+ block of epithelial Na+ channels in planar lipid bilayers. Biophys. J. 80:2176–2186. - PMC - PubMed
    1. Bradford, A.L., I.I. Ismailov, J.M. Achard, D.G. Warnock, J.K. Bubien, and D.J. Benos. 1995. Immunopurification and functional reconstitution of a Na+ channel complex from rat lymphocytes. Am. J. Physiol. 269:C601–C611. - PubMed

Publication types