. 2005 Jan 11;102(2):331-6.
doi: 10.1073/pnas.0403350102. Epub 2004 Dec 29.

Noisy signal amplification in ultrasensitive signal transduction

Affiliations

Noisy signal amplification in ultrasensitive signal transduction

Tatsuo Shibata et al. Proc Natl Acad Sci U S A. .

Abstract

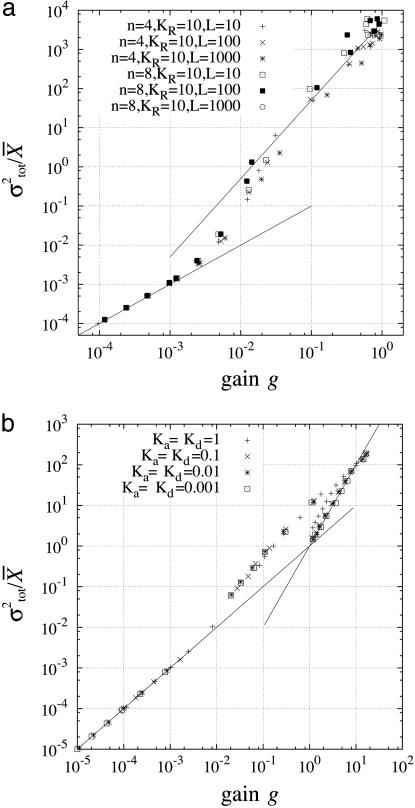
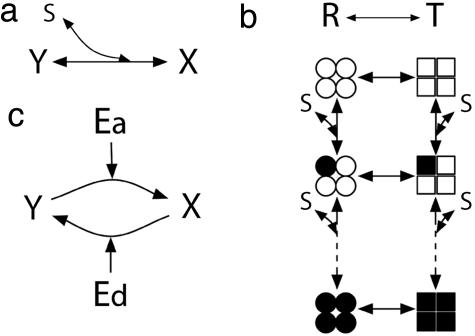
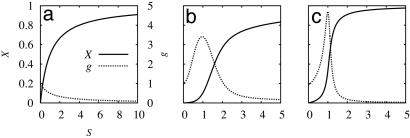
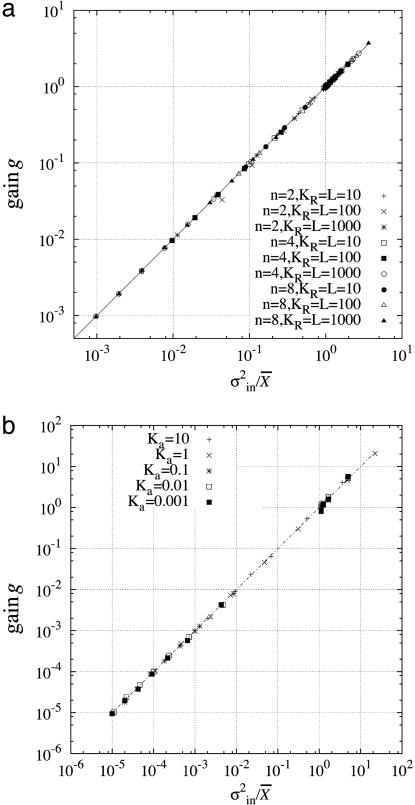
Because intracellular processes are inherently noisy, stochastic reactions process noisy signals in cellular signal transduction. One essential feature of biological signal transduction systems is the amplification of small changes in input signals. However, small random changes in the input signals could also be amplified, and the transduction reaction can also generate noise. Here, we show theoretically how the abrupt response of ultrasensitive signal-transduction reactions results in the generation of large inherent noise and the high amplification of input noise. The inherently generated noise propagates with amplification through intracellular molecular network. We discuss how the contribution of such transmitted noise can be shown experimentally. Our results imply that the switch-like behavior of signal transduction could be limited by noise; however, high amplification reaction could be advantageous to generate large noise, which would be essential to maintain behavioral variability.


Figures

Fig. 4.
Fig. 4.
Amplification of noise in signal-transduction systems. To show the dependence of the total noise intensity σtot on the gain g, σtot/ is plotted as a function of the gain g. Changing the average concentration of the input signal, g, σtot, and were obtained numerically. The numerical calculation was performed by using the Gillespie's algorithm (20), as in Fig. 3. In the present case, the concentration of the input signal also fluctuates in time, and the average concentration increases under the condition that the relative noise intensity is maintained to be constant. The following parameters are shown: the MWC model KT = 1, KR indicated in a; the push–pull reaction, Va = Vd = 10, Ka and Kd indicated in b.
Fig. 1.
Fig. 1.
Three typical signal-transduction reactions. (a) The Michaelis–Menten-type reaction. (b) The Cooperative binding reaction. (c) The push–pull antagonistic reaction. The circle indicates the R state and the square is the T state. The subunits that are occupied by substrates are filled.
Fig. 2.
Fig. 2.
Ultrasensitive responses in signal-transduction reactions. The fractional concentration of the output signal X (left axis) and the gain g (right axis) are plotted as functions of the concentration of signal molecule. The Michaelis–Menten-type reaction (a), the MWC model (b), and the push–pull antagonistic reaction (c) are shown.
Fig. 3.
Fig. 3.
The gain–intrinsic noise relation of signal transduction systems. The gain g is plotted as a function of the variance divided by the mean number. Changing the concentration of the input signal S, the gain, the variance, and the mean number are obtained by performing stochastic simulations of schemes, as shown in Eqs. 2 and 3, according to the Gillespie's numerical algorithm (20). (a) The MWC model. We used the parameter values: KT = 1, and n, KR, and L shown in the figure. The kinetic constants were arbitrarily chosen. (b) The push–pull reaction. The Michaelis constant is Ka for the activation reaction, as is indicated, and Kd = 1 for the deactivation reaction. The maximum velocities of activation and deactivation reactions are given by Va = Vd = 100, respectively.
Fig. 5.
Fig. 5.
The frequency-dependent total, intrinsic, and extrinsic noise intensities, shown in Eq. 20, with particular parameter values plotted as functions of the frequency ω. The intrinsic noise (dashed line) is dominant in the higher-frequency region, whereas the extrinsic noise (dotted line) is dominated in the lower-frequency region.

References

    1. Koshland, D. E., Jr. (1998) Science 280, 852-853. - PubMed
    1. Monod, J., Wyman, J. & Changeux, J. P. (1965) J. Mol. Biol. 12, 88-118. - PubMed
    1. Koshland, D. E., Jr., Nemethy, G. & Filmer, D. (1966) Biochemistry 5, 365-385. - PubMed
    1. Stadtman, E. R. & Chock, P. B. (1977) Proc. Natl. Acad. Sci. USA 74, 2761-2765. - PMC - PubMed
    1. Goldbeter, A. & Koshland, D. E., Jr., (1981) Proc. Natl. Acad. Sci. USA 8, 6840-6844. - PMC - PubMed

Publication types

LinkOut - more resources