

Analysis of oligonucleotide array experiments with repeated measures using mixed models
- PMID: 15626348
- PMCID: PMC544885
- DOI: 10.1186/1471-2105-5-209
Analysis of oligonucleotide array experiments with repeated measures using mixed models
Abstract
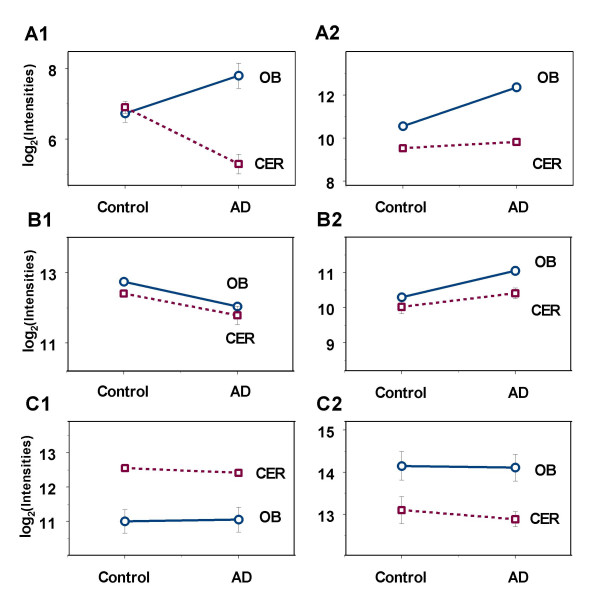
Background: Two or more factor mixed factorial experiments are becoming increasingly common in microarray data analysis. In this case study, the two factors are presence (Patients with Alzheimer's disease) or absence (Control) of the disease, and brain regions including olfactory bulb (OB) or cerebellum (CER). In the design considered in this manuscript, OB and CER are repeated measurements from the same subject and, hence, are correlated. It is critical to identify sources of variability in the analysis of oligonucleotide array experiments with repeated measures and correlations among data points have to be considered. In addition, multiple testing problems are more complicated in experiments with multi-level treatments or treatment combinations.
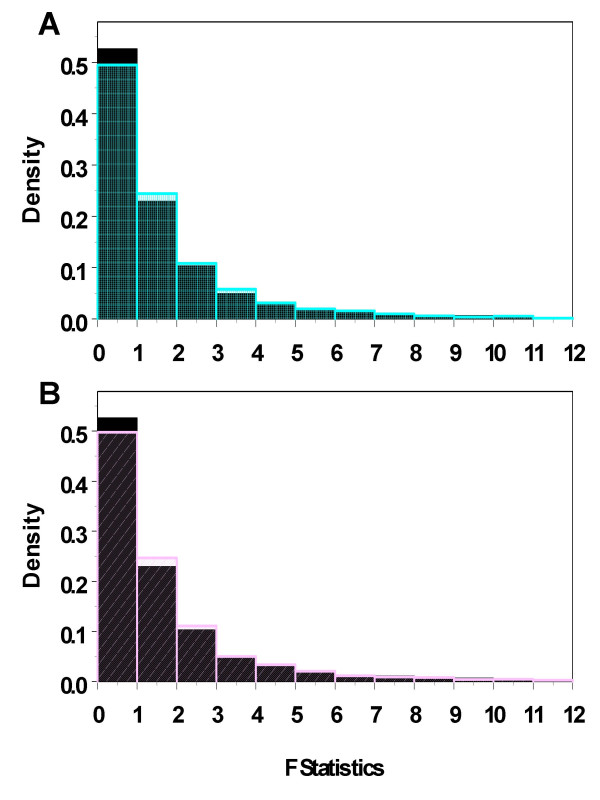
Results: In this study we adopted a linear mixed model to analyze oligonucleotide array experiments with repeated measures. We first construct a generalized F test to select differentially expressed genes. The Benjamini and Hochberg (BH) procedure of controlling false discovery rate (FDR) at 5% was applied to the P values of the generalized F test. For those genes with significant generalized F test, we then categorize them based on whether the interaction terms were significant or not at the alpha-level (alphanew = 0.0033) determined by the FDR procedure. Since simple effects may be examined for the genes with significant interaction effect, we adopt the protected Fisher's least significant difference test (LSD) procedure at the level of alphanew to control the family-wise error rate (FWER) for each gene examined.
Conclusions: A linear mixed model is appropriate for analysis of oligonucleotide array experiments with repeated measures. We constructed a generalized F test to select differentially expressed genes, and then applied a specific sequence of tests to identify factorial effects. This sequence of tests applied was designed to control for gene based FWER.
Figures
References
-
- Verbeke G, Molenberghs G. Linear Mixed models for longitudinal data. Springer, New York, NY. 2000.
-
- Fisher RA. The Design of Experiments, 6th edn. Edinburgh: Oliver and Boyd Ltd. 1951.
Publication types
MeSH terms
Grants and funding
LinkOut - more resources
Full Text Sources
Miscellaneous
