Comparative Study
. 2005 Mar;88(3):1646-58.
doi: 10.1529/biophysj.104.055301. Epub 2004 Dec 30.

Mathematical modeling of the eukaryotic heat-shock response: dynamics of the hsp70 promoter

Affiliations
Comparative Study

Mathematical modeling of the eukaryotic heat-shock response: dynamics of the hsp70 promoter

Theodore R Rieger et al. Biophys J. 2005 Mar.

Abstract

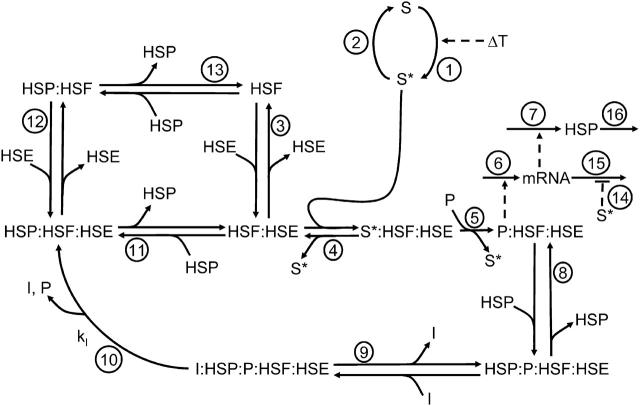
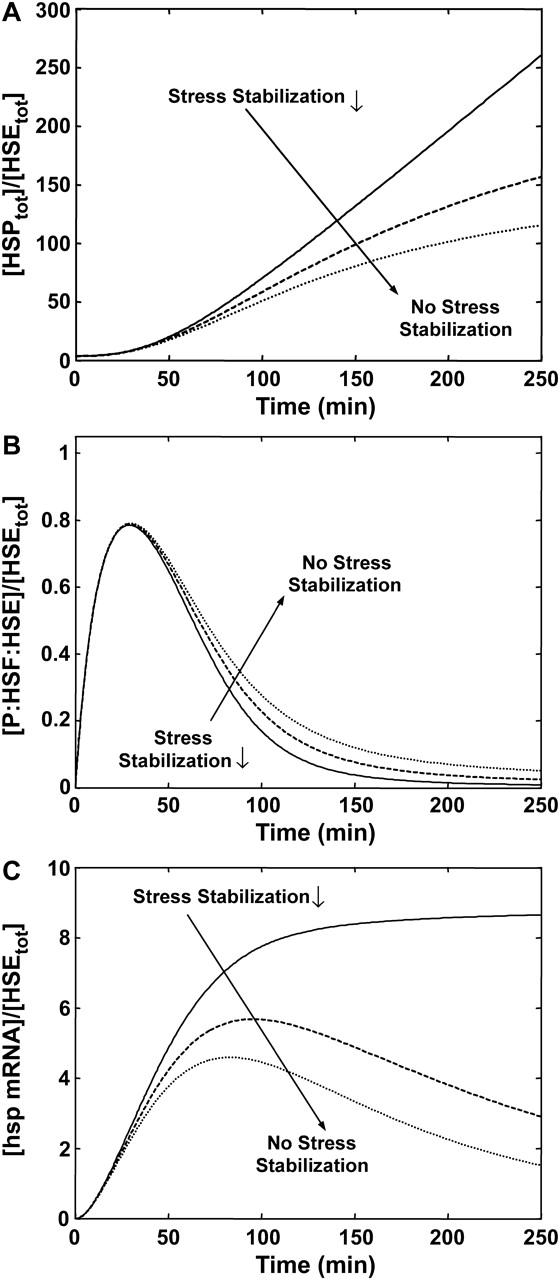
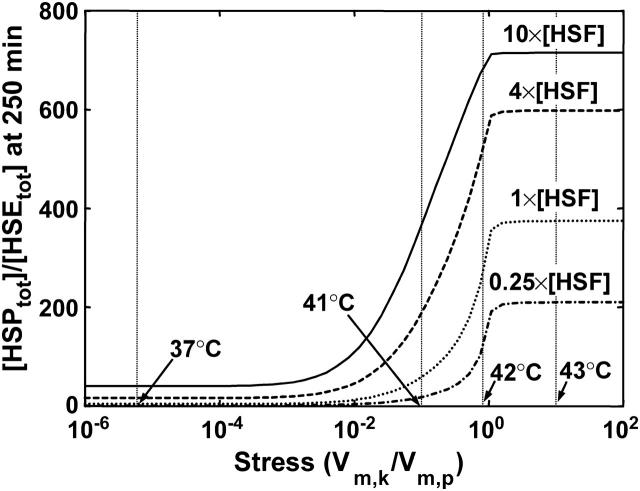
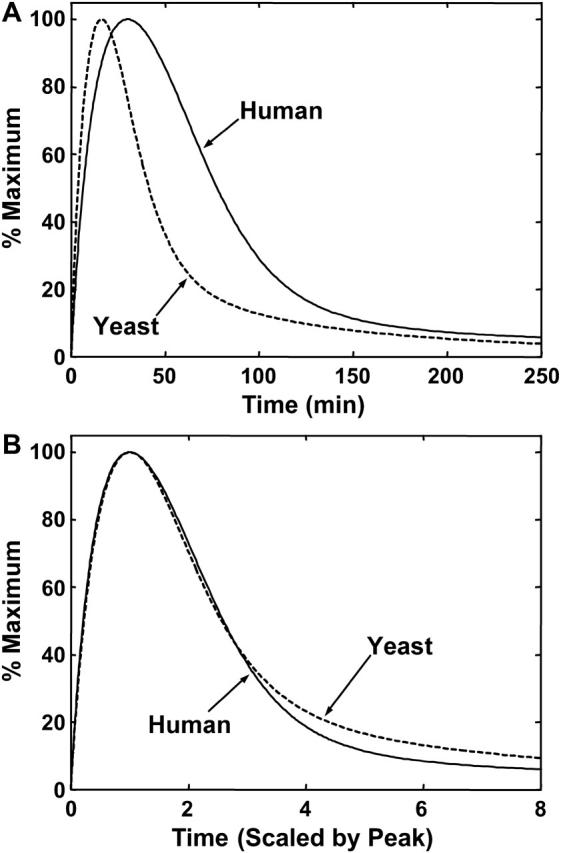
The heat-shock response in humans and other eukaryotes is a highly conserved genetic network that coordinates the cellular response to protein damage and is essential for adaptation and survival of the stressed cell. It involves an immediate and transient activation of heat-shock transcription factor-1 (HSF1) which results in the elevated expression of genes encoding proteins important for protein homeostasis including molecular chaperones and components of the protein degradative machinery. We have developed a mathematical model of the critical steps in the regulation of HSF1 activity to understand how chronic exposure to a stress signal is converted into specific molecular events for activation and feedback regulated attenuation of HSF1. The model is utilized to identify the most sensitive steps in HSF1 activation and to evaluate how these steps affect the expression of molecular chaperones. This analysis allows the formulation of hypotheses about the differences between the heat-shock responses in yeast and humans and generates a model with predictive abilities relevant to diseases associated with the accumulation of damaged and aggregated proteins including cancer and neurodegenerative diseases.


Figures

FIGURE 1
FIGURE 1
Minimal model of HSP expression and regulation. X:Y denotes X bound to Y. Solid lines indicate mass flow or chemical reactions, and dashed lines indicate regulatory interactions. The circled numbers correlate each step in the molecular mechanism with its description below and the associated kinetic and thermodynamic parameters in Tables 2, 4, and 5. Heat-shock, or temperature (T), enters the model through switching the stress-dependent kinase (S) from its inactive to active form (S*) (1). The stress kinase is inactivated by dephosphorylation back to its inactive form (2). The transcription factor (HSF) binds to the promoter site (HSE) (3), where it is bound by the active stress kinase (4) and is phosphorylated to its active form (P:HSF:HSE) (5), that induces transcription (6) and translation (7). HSP binds to the active form, repressing transcription (8). The inactive form is subject to binding (9) dephosphorylation (10) by the inactivating phosphatase (I). HSP also binds HSF on the HSE, before it is phosphorylated (11), or off the DNA HSP binds and sequesters HSF in solution (HSF:HSP) (12, 13). The mRNA is assumed to be stabilized by S* (14), but mRNA and HSP still turn over via first-order decay (15, 16).
FIGURE 2
FIGURE 2
Dynamics of the human heat-shock response experimental results and model simulation. (A) Experimental study by Kline and Morimoto (1997) of heat-shock of HeLa cells at 42°C for 250 min. The phosphorylation of the HSF (dashed line), binding of HSF to the DNA (solid line), and transcription rate of hsp70 mRNA (dash-dotted line) are all observed to rapidly activate between t = 0–35 min, then attenuate back to their basal level over the next ∼200 min. See reference for original materials and methods. (B) Model simulation of the Kline and Morimoto (1997) results. Plotted are the same three variables as for the experiments in A: phosphorylation, total binding of HSF to the HSE, and transcription rate of hsp70 mRNA. All variables in A and B were rescaled as a percentage of their maximum value (peak).
FIGURE 3
FIGURE 3
Model prediction and experimental validation for stress and recovery at different temperatures. (A) Model simulation of the dynamics of the transcription rate of hsp70 mRNA if the cells were heat-shocked at 42°C for 250 min (solid lines) or shifted back to 37°C at the peak of the heat-shock response (dashed lines). (B) Experimental validation of A, from Abravaya et al. (1991a). Lines are the same as in A. See original reference for materials and methods. All variables in A and B were rescaled as a percentage of their maximum value (peak). (C) Model simulation of the dynamics of phosphorylated HSF (scaled by total HSE concentration) at three different heat-shock temperatures, 37°C to 41°C (dashed line), 42°C (dash-dot line), or 43°C (solid line), and maintained there for 300 min. (D) Experimental results for heat-shock of HeLa cells at varying temperatures from Abravaya et al. (1991a). See original reference for materials and methods.
FIGURE 4
FIGURE 4
Role of HSP feedback in regulation of the heat-shock response. (A) Dynamics of HSP and (B) phosphorylated HSF versus time at 42°C with varying binding affinity of HSP for P:HSF:HSE. The binding affinity was changed by 0.25 (dotted line), 1 (solid line), and 4 (dashed line) fold. (C) Dynamics of HSP and (D) phosphorylated HSF versus time at 42°C with varying binding affinity of HSP for HSF. The binding affinity was changed by 0.1 (dotted line), 1 (solid line), and 10 (dashed line) fold.
FIGURE 5
FIGURE 5
Role of stress stabilization of mRNA in regulation of the heat-shock response. (A) Dynamics of HSP, (B) phosphorylated HSF, and (C) hsp mRNA versus time at 42°C with varying coupling between S* and degradation of mRNA. The stress stabilization is varied from baseline (solid line), to an intermediate value (dashed line), to no stress stabilization (dotted line).
FIGURE 6
FIGURE 6
Effect of an increase or decrease in HSF concentration on HSP concentration at varying stress levels. Stress is the relative catalytic activity of the kinase of S to the phosphatase of S* formula image The dimensionless HSF concentration was varied by 0.25 (dash-dot line), 1 (dotted line), 4 (dashed line), and 10 (solid line) fold. For each stress and HSF concentration, the concentration of HSP (scaled by the concentration of HSEs) is plotted after a 250-min heat-shock. For reference, the stresses that correspond to 37°C, 41°C, 42°C, and 43°C are shown.
FIGURE 7
FIGURE 7
Comparison of the dynamics of the heat-shock response in yeast versus humans with and without time rescaling. (A) Dynamics of phosphorylated HSF in humans (solid line) and yeast (dashed line) versus time at 42°C, or equivalent temperature in yeast. (B) Same as A, but the timescale of each species' heat-shock response has been scaled by its time to peak in A.

References

    1. Abravaya, K., B. Phillips, and R. I. Morimoto. 1991a. Attenuation of the heat-shock response in Hela-cells is mediated by the release of bound heat-shock transcription factor and is modulated by changes in growth and in heat-shock temperatures. Genes Dev. 5:2117–2127. - PubMed
    1. Abravaya, K., B. Phillips, and R. I. Morimoto. 1991b. Heat-shock-induced interactions of heat-shock transcription factor and the human hsp70 promoter examined by in vivo footprinting. Mol. Cell. Biol. 11:586–592. - PMC - PubMed
    1. Asthagiri, A. R., and D. A. Lauffenburger. 2001. A computational study of feedback effects on signal dynamics in a mitogen-activated protein kinase (MAPK) pathway model. Biotechnol. Prog. 17:227–239. - PubMed
    1. Baler, R., G. Dahl, and R. Voellmy. 1993. Activation of human heat-shock genes is accompanied by oligomerization, modification, and rapid translocation of heat-shock transcription factor HSF1. Mol. Cell. Biol. 13:2486–2496. - PMC - PubMed
    1. Bates, G. 2003. Huntingtin aggregation and toxicity in Huntington's disease. Lancet. 361:1642–1644. - PubMed

Publication types

MeSH terms