

Spatial association of homologous pericentric regions in human lymphocyte nuclei during repair
- PMID: 15626712
- PMCID: PMC1305280
- DOI: 10.1529/biophysj.104.048728
Spatial association of homologous pericentric regions in human lymphocyte nuclei during repair
Abstract
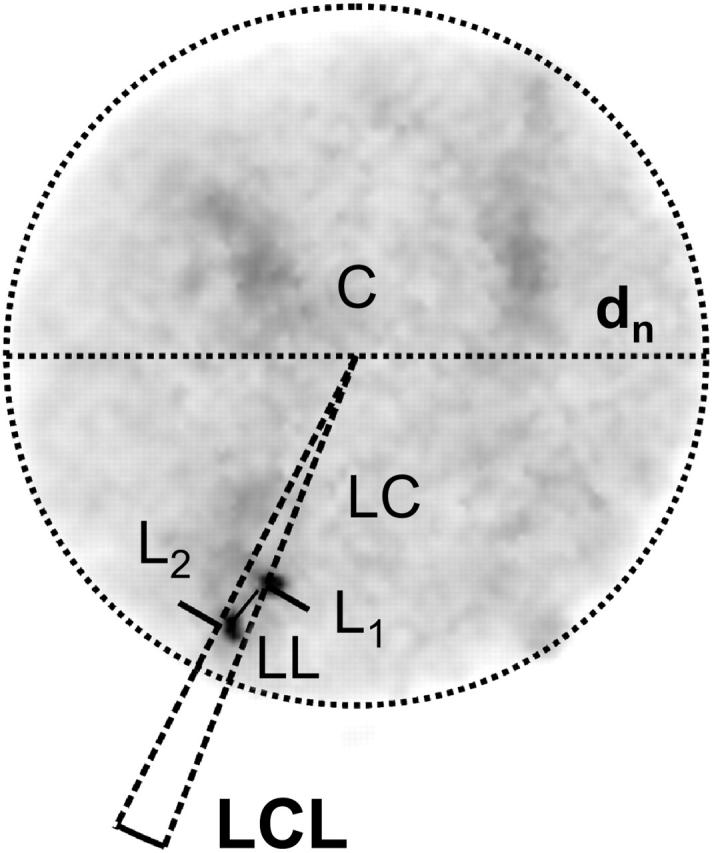
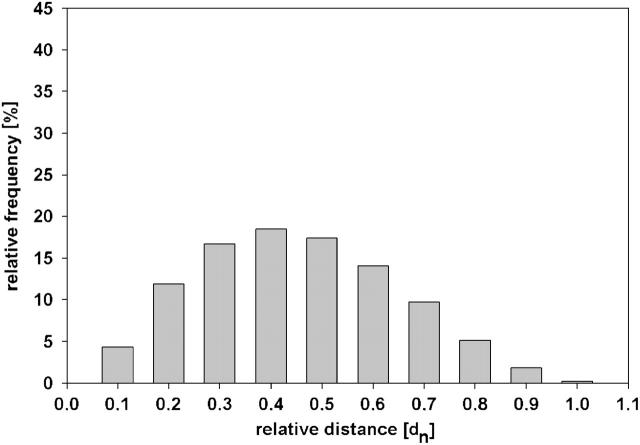
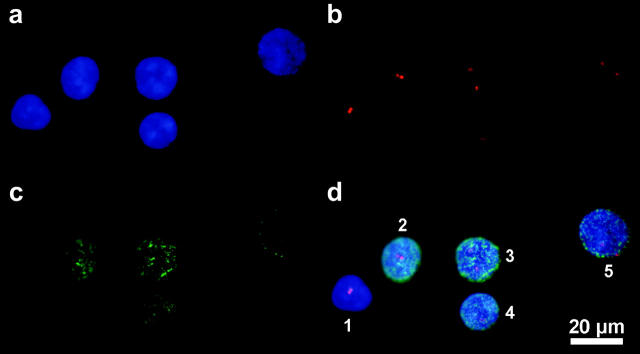
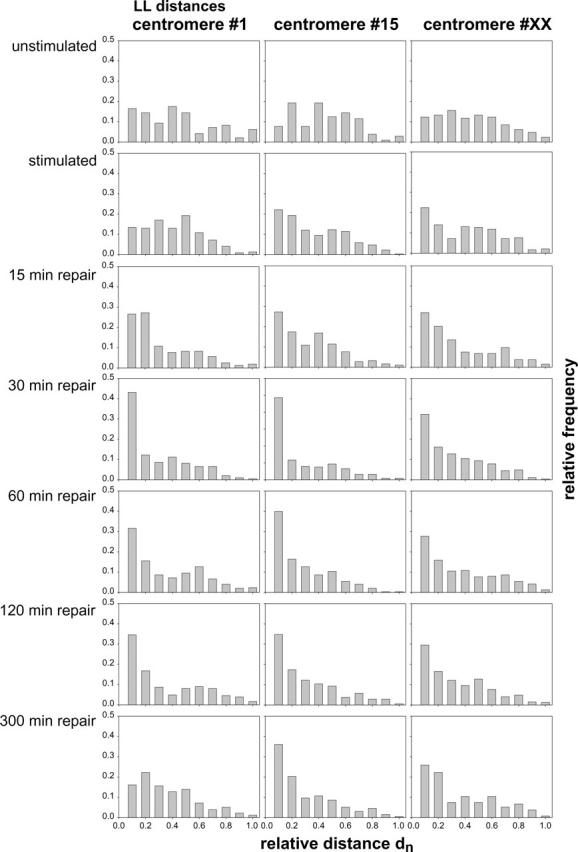
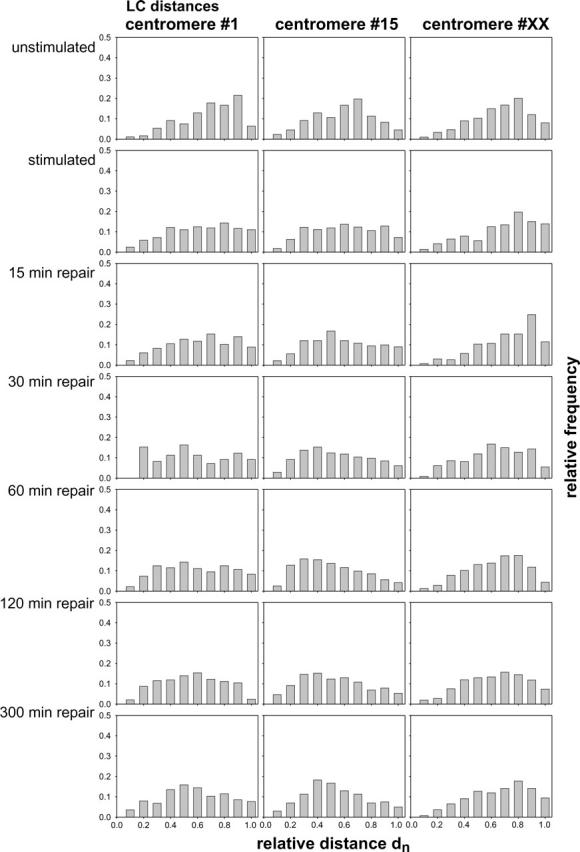
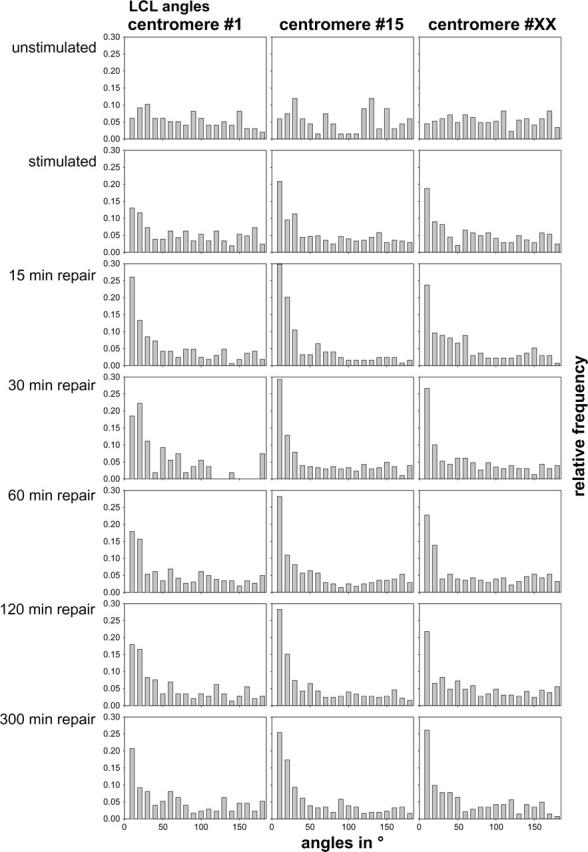
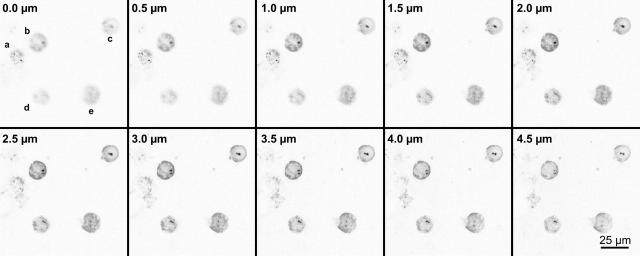
Spatial positioning of pericentric chromosome regions in human lymphocyte cell nuclei was investigated during repair after H(2)O(2)/L-histidine treatment. Fifteen to three-hundred minutes after treatment, these regions of chromosomes 1, 15, and X were labeled by fluorescence in situ hybridization. The relative locus distances (LL-distances), the relative distances to the nuclear center (LC-distances), and the locus-nuclear center-locus angles (LCL-angles) were measured in approximately 5000 nuclei after two-dimensional microscopy. Experimental frequency histograms were compared to control data from untreated stimulated and quiescent (G(0)) nuclei and to a theoretical two-dimensional projection from random points. Based on the frequency distributions of the LL-distances and the LCL-angles, an increase of closely associated labeled regions was found shortly after repair activation. For longer repair times this effect decreased. After 300 min the frequency distribution of the LL-distances was found to be compatible with the random distance distribution again. The LL-distance frequency histograms for quiescent nuclei did not significantly differ from the theoretical random distribution, although this was the case for the stimulated control of chromosomes 15 and X. It may be inferred that, concerning the distances, homologous pericentric regions appear not to be randomly distributed during S-phase, and are subjected to dynamic processes during replication and repair.
Figures
References
-
- Abdel-Halim, H. I., S. A. Imam, F. M. Badr, A. T. Natarajan, L. H. F. Mullenders, and J. J. W. A. Boei. 2004. Ionizing radiation-induced instant pairing of heterochromatin of homologous chromosomes in human cells. Cytogenet. Genome Res. 104:193–199. - PubMed
-
- Amrichová, J., E. Lukásová, S. Kozubek, and M. Kozubek. 2003. Nuclear and territorial topography of chromosome telomeres in human lymphocytes. Exp. Cell Res. 289:11–26. - PubMed
-
- Arnoldus, E. P. J., A. C. B. Peters, G. T. A. Bots, A. K. Raap, and M. van der Ploeg. 1989. Somatic pairing of chromosome 1 centromeres in interphase nuclei of human cerebellum. Hum. Genet. 83:231–234. - PubMed
-
- Aten, J. A., J. Stap, P. M. Krawczyk, C. H. van Oven, R. A. Hoebe, J. Essers, and R. Kanaar. 2004. Dynamics of DNA double-strand breaks revealed by clustering of damaged chromosome domains. Science. 303:92–95. - PubMed
-
- Bártová, E., S. Kozubek, M. Durm, M. Hausmann, M. Kozubek, E. Lukášová, M. Skalniková, P. Jirsová, A. Cafourková, and K. Buchničková. 1999. The position of centromeres in the interphase nuclei of human leukemic cells during myeloid differentiation and after γ-irradiation. In Fluorescence Microscopy and Fluorescent Probes, Vol. 3. A. Kotyk, editor. Espero Publishing, Ustí Nad Labem, Czech Republic.
Publication types
MeSH terms
Substances
LinkOut - more resources
Full Text Sources
