

doi: 10.1016/s1672-0229(03)01029-5.
EST pipeline system: detailed and automated EST data processing and mining
Affiliations
- PMID: 15629036
- PMCID: PMC5172240
- DOI: 10.1016/s1672-0229(03)01029-5
Item in Clipboard
EST pipeline system: detailed and automated EST data processing and mining
Genomics Proteomics Bioinformatics.
2003 Aug.
Abstract
Expressed sequence tags (ESTs) are widely used in gene survey research these years. The EST Pipeline System, software developed by Hangzhou Genomics Institute (HGI), can automatically analyze different scalar EST sequences by suitable methods. All the analysis reports, including those of vector masking, sequence assembly, gene annotation, Gene Ontology classification, and some other analyses, can be browsed and searched as well as downloaded in the Excel format from the web interface, saving research efforts from routine data processing for biological rules embedded in the data.
Figures

The index page of the EST Pipeline System. Users can get concise information of each view.

The Library View. We used the rice EST project as an example. There are two species, indica and nipponbare, in this project. We could easily tell the information of each library from this view, and then choose the library which we are interested in to view more detailed results in detailed library view, sequence view and contig view.

The distribution of average sequence quality. The X-axis is the quality from 0 to 50. This figure shows that all the quality of the sequences is above 20 because the system cuts off the low-quality bases, which is re-definable during base-calling. The Y-axis is the number of sequence in each range of the average quality.

The distribution of sequence length. The X-axis is the sequence length and the Y-axis is the number of the sequence within the range of sequence length.
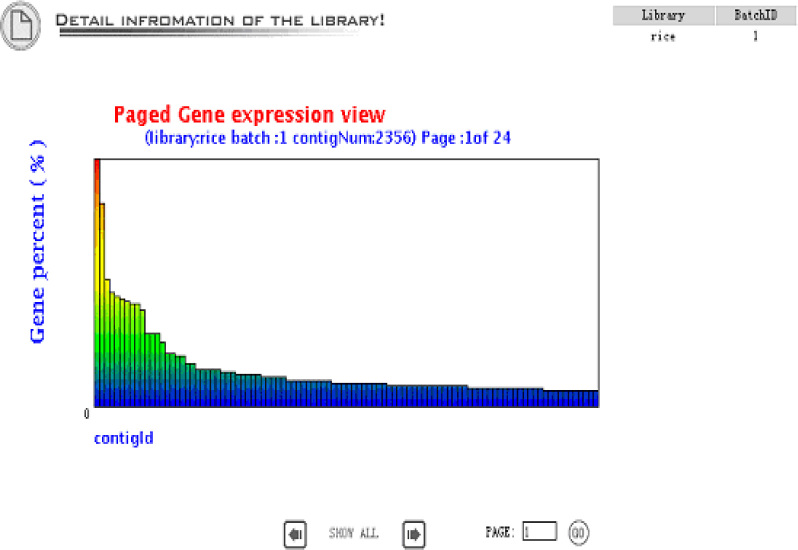
Gene expression view is an overview of the gene expression profile in the library. The gene abundance means the contig size divided by the total EST number in the library.

The distribution of the GC content. The X-axis is the GC content and the Y-axis is the sequence number of the GC content.

The Sequence View shows the basic information about each EST sequence in the library. It will be helpful for users who are interested in some special sequences. On the left of the page there are filters for users to search sequences by Contig ID, Sequence ID, Raw length, Trimmed length, and Quality, etc.

The Contig View. Contig size is one of the most important properties of a contig to define the expressing level of the gene. The columns BlastN Annotation and BlastX Annotation list the taken annotation from NCBI non-redundant and SWISS-PROT database, respectively. Different colors are used to indicate the cellular component, molecular function and biological process aspect of Gene Ontology classification. Detailed graphical view and list view are available by clicking the “detail” button

Graphical detail-alignment view. This view shows directly the alignment result between contigs and BLAST database hits. Each line means one hit and each arrowed line indicates an HSP with its orientation. The mouse over event would bring up detailed text boxes for the information of score, length, start, end, etc. of each hits or HSP.

A part of the tree view. The number beside the cell wall indicates there are six contigs classified into this functional category, and branches bellow show the detailed functional category under the father category.
References
-
- Mao C. ESTAP-an automated system for the analysis of EST data. Bioinformatics. 2003;19:1720–1722. - PubMed
-
- Palmer L.E. A survey of canine expressed sequence tags and a display of their annotations through a flexible web-based interface. J. Hered. 2003;94:15–22. - PubMed
-
- Altschul S.F. Basic local alignment search tool. J. Mol. Biol. 1990;215:403–410. - PubMed
-
- Gish W., States D.J. Identification of protein coding regions by database similarity search. Nat. Genet. 1993;3:266–272. - PubMed
-
- Ewing B. Base-calling of automated sequencer traces using phred. I. Accuracy assessment. Genome Res. 1998;8:175–185. - PubMed
MeSH terms
LinkOut - more resources
Full Text Sources
Research Materials
