. 2005 Jan;166(1):275-86.
doi: 10.1016/S0002-9440(10)62251-1.

Brain and bone damage in KARAP/DAP12 loss-of-function mice correlate with alterations in microglia and osteoclast lineages

Affiliations

Brain and bone damage in KARAP/DAP12 loss-of-function mice correlate with alterations in microglia and osteoclast lineages

Serge Nataf et al. Am J Pathol. 2005 Jan.

Abstract

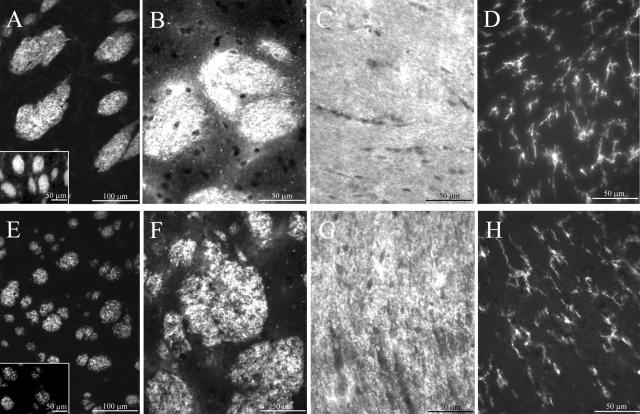
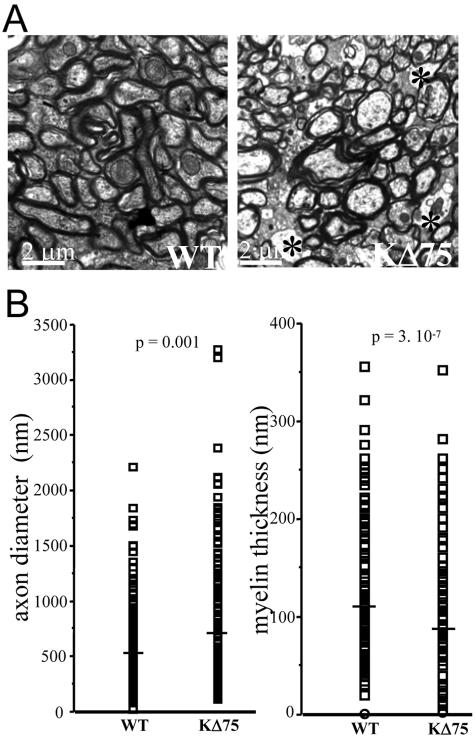
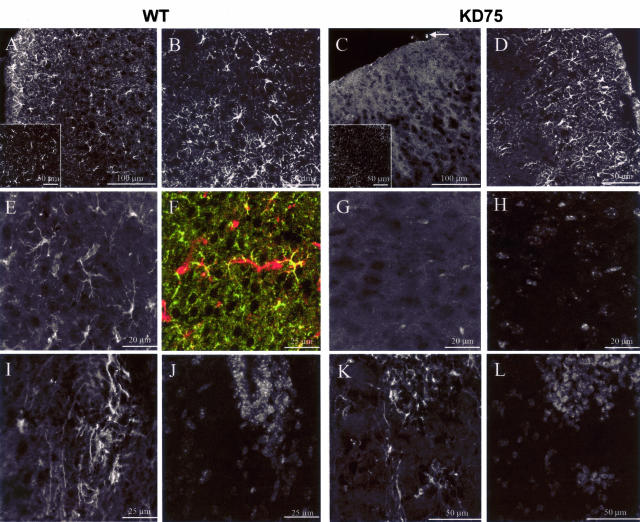
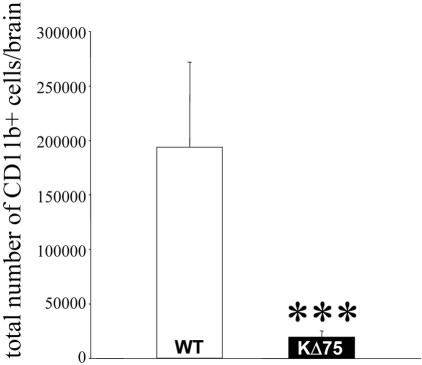
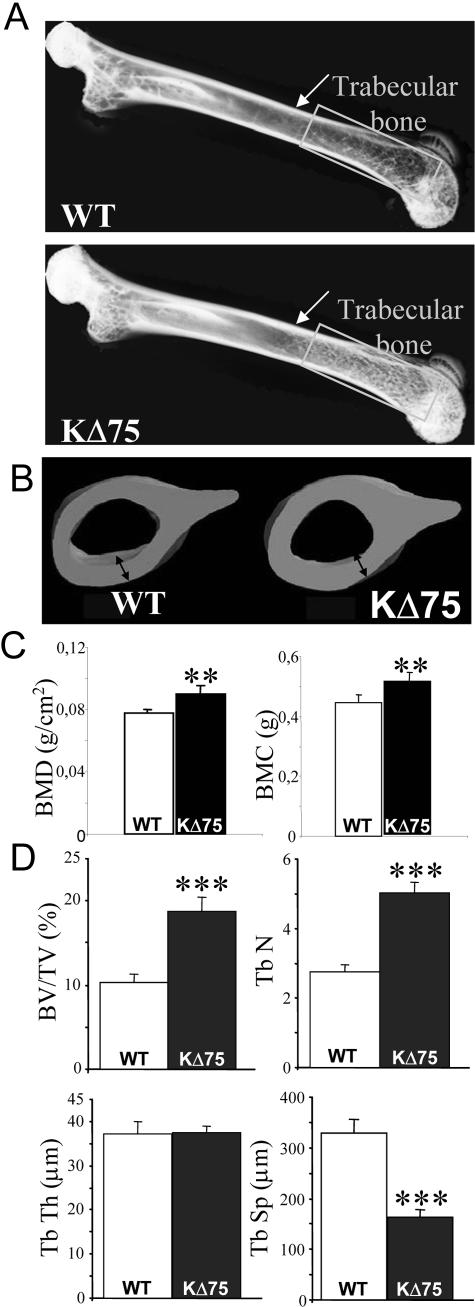
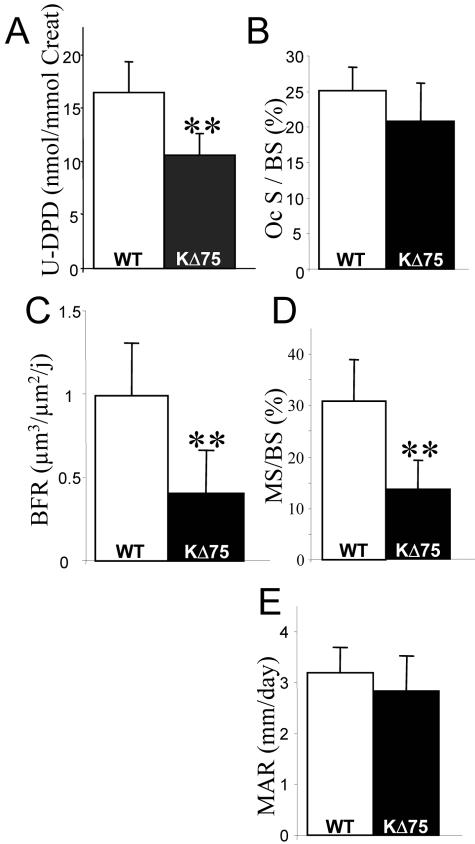
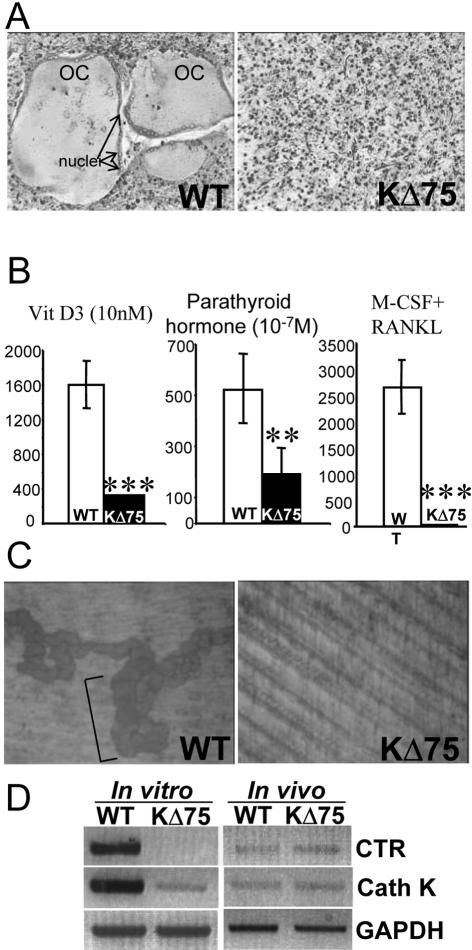
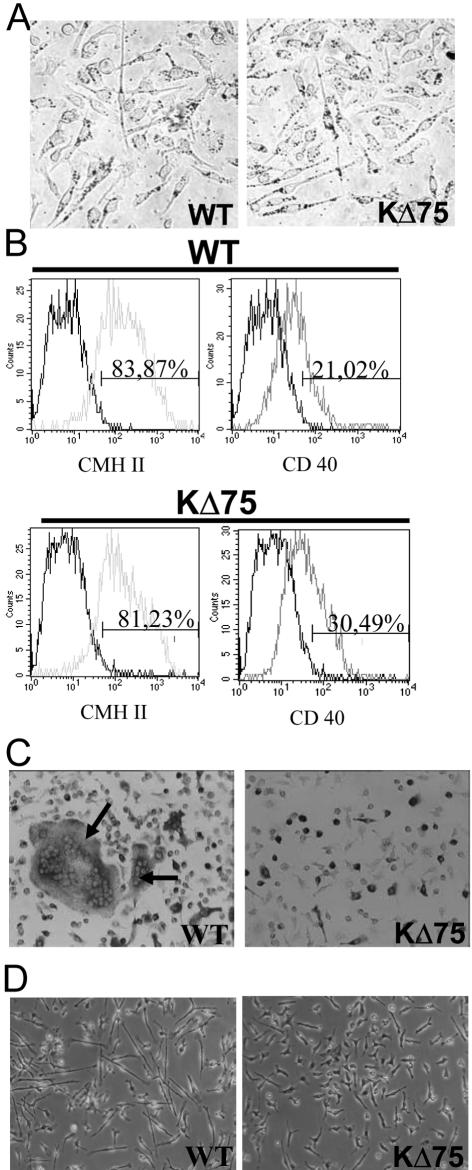
Human polycystic lipomembraneous osteodysplasia with sclerosing leukoencephalopathy, also known as Nasu-Hakola disease, has been described to be associated with mutations affecting the immunoreceptor tyrosine-based activation motif-bearing KARAP/DAP12 immunoreceptor gene. Patients present bone fragilities and severe neurological alterations leading to presenile dementia. Here we investigated whether the absence of KARAP/DAP12-mediated signals in loss-of-function (KDelta75) mice also leads to bone and central nervous system pathological features. Histological analysis of adult KDelta75 mice brains revealed a diffuse hypomyelination predominating in anterior brain regions. As this was not accompanied by oligodendrocyte degeneration or microglial cell activation it suggests a developmental defect of myelin formation. Interestingly, in postnatal KDelta75 mice, we observed a dramatic reduction in microglial cell numbers similar to in vitro microglial cell differentiation impairment. Our results raise the intriguing possibility that defective microglial cell differentiation might be responsible for abnormal myelin development. Histomorphometry revealed that bone remodeling is also altered, because of a resorption defect, associated with a severe block of in vitro osteoclast differentiation. In addition, we show that, among monocytic lineages, KARAP/DAP12 specifically controls microglial and osteoclast differentiation. Our results confirm that KARAP/DAP12-mediated signals play an important role in the regulation of both brain and bone homeostasis. Yet, important differences exist between the symptoms observed in Nasu-Hakola patients and KDelta75 mice.


Figures

Figure 1
Figure 1
Brain hypomyelination and lack of inflammation in KΔ75 loss-of-function mice. CNPase (A, E) or MBP staining (B, C, F, G) was performed on horizontal brain sections of striatum (A, B, E, F) and corpus callosum (C, G) obtained from control (A–C) or KΔ75 mice (E–G). Insets in A and E show high-magnification views of CNPase stainings. Note the heterogeneous MBP or CNPase staining pattern observed in KΔ75 mice as compared to controls. CD11b staining was performed on horizontal brain sections of corpus callosum (D, H). CD11b+ microglial cells have similar morphology when comparing WT (D) and KARAP/DAP12 loss-of function mice (H). Data are representative of three experiments performed on the 16 mice analyzed.
Figure 2
Figure 2
Brain ultrastructural pathology in KΔ75 loss-of-function mice. A: Transverse sections of brain striatum isolated from control mice (left) or KΔ75 mice (right) were analyzed by electron microscopy. Unmyelinated axons in the white matter tracts of a KΔ75 mouse are indicated by black asterisks. B: Measurements of axon diameter and myelin thickness were performed on KΔ75 mice (n = 2) and controls (n = 2). Mean myelin thickness is dramatically decreased in KΔ75 mice (87 ± 18 nm, n = 330) as compared to controls (112 ± 17 nm, n = 315, P = 3.10−7 with unequal variance, Student’s t-test) (right). In contrast, mean axon diameter is significantly increased in KΔ75 mice (696 ± 34 nm, n = 245) as compared to controls (577 ± 21 nm, n = 254, P = 0.001 with unequal variance, Student’s t-test) (left).
Figure 3
Figure 3
Immunohistofluorescence analysis of postnatal microglia in KΔ75 mice. A–L: Immunohistofluorescence experiments were performed on transverse sections of anterior brain obtained from control postnatal 15-day WT (left; A, B, E, F, I, J) or KΔ75 mice (right; C, D, G, H, K, L). CD11b staining (A, C) shows that as opposed to controls (A), KΔ75 mice lack detectable microglial cells (C). However meningeal macrophages are still present in KΔ75 mice (white arrow in C). Insets in A and C show confocal images of CD11b staining in control (A) or KΔ75 mice (C). Note that only background fluorescence and no cellular CD11b staining is observable by confocal analysis in KΔ75 mice (inset in C). GFAP staining (B and D) is unaltered in KΔ75 as compared to WT mice. Nestin staining of frontal cortex sections (E–G) allows ramified cells to be detected (E, white; F, red) co-expressing CD11b (F, green) in WT (E, F) but not in KΔ75 mice (G, counterstained with DAPI in H). Nestin+ cells are detectable in the frontal subventricular zone of WT (I, counterstained with DAPI in J) or KΔ75 mice (K, counterstained with DAPI in L). Data are representative of three experiments performed on six mice analyzed on P15 and five mice analyzed on P10 (CD11b staining only for P10 brains).
Figure 4
Figure 4
FACS analysis of postnatal microglia in KΔ75 mice. Total CD11b+ cell number per brain was evaluated by ex vivo FACS analysis of brain obtained from P13 WT (n = 6) or KΔ75 mice. ***, P < 0.01 with unequal variance, Student’s t-test.
Figure 5
Figure 5
In vivo analysis of bone remodeling in ΚΔ75 loss-of-function mice. A: X-ray radiographs of femurs isolated from control C57BL/6 (top) and 5-month-old KΔ75 mice (bottom). Cortical bone in the metaphysis is indicated by an arrow whereas the trabecular bone area in the epiphysis is underlined by rectangles. Images are representative of six mice analyzed for each genotype. B: Micro-CT three-dimensional analysis of femurs isolated from the same WT (left) and KΔ75 (right) mice as in A. Double-headed arrows point to cortical bone thickness. C: DEXA quantification of bone mineral content (BMC) and evaluation of bone mineral density (BMD) of 5-month-old control and KΔ75 mice (n = 7). D: Histomorphometric measures on tibiae of 5-month-old control and KΔ75 mice: bone volume/tissue volume (BV/TV), trabecular number (Tb N), trabecular thickness (Tb Th), and trabecular separation (Tb Sp) are indicated (n = 7).
Figure 6
Figure 6
Physiological analysis of bone remodeling by histomorphometry. A: Urinary DPD levels analyzed in control (open bars) and KΔ75 mice (filled bars) are expressed as mean ± SEM and were performed on the same two groups of six mice. Histomorphometric dynamic parameters: percentage of bone trabecular surface covered by TRAP+ osteoclasts (Oc S/BS) (B); bone formation rate (BFR) (C); percentage of bone trabecular surface labeled with calcein (MS/BS) (D); mineral apposition rate (MAR) (E). All results have been analyzed by the Student’s t-test (**, P < 0.01) with measurements on at least six animals.
Figure 7
Figure 7
In vitro differentiation of osteoclasts in the absence of KARAP/DAP12-mediated signaling. A: Osteoclasts were differentiated in vitro from control (left) and KΔ75 mice (right) bone marrow cells in the presence of M-CSF plus RANKL and then stained for TRAP activity. Large multinucleated TRAP-positive cells (OC) were obtained from WT but none from KΔ75 mice bone marrows. Arrows point to nuclei of multinucleated TRAP-positive osteoclasts. B: Osteoclast differentiation yields obtained using indicated stimuli from cultures of control (open bars) and KΔ75 (filled bars) bone marrow cells are represented by mean ± SEM of number of TRAP+ cells. Results from three independent experiments have been analyzed by the Student’s t-test (***, P < 0.001; **, P < 0.01). C: Osteoclasts were differentiated in vitro, in the presence of M-CSF plus RANKL, directly onto dentin slices. On day 7 of culture, resorption activity was evaluated in culture of control (left) and KΔ75 (right) bone marrow cells. Typical pits (brackets) are observed with WT but none with KΔ75-derived bone marrow cells. D: KΔ75 mice-derived osteoclast differentiation pathway is blocked early in vitro whereas osteoclast function is altered in vivo. Cathepsin K (Cath K) and calcitonin receptor (CTR) expression levels from either osteoclasts obtained in vitro from bone marrow cells maintained for a week in the presence of M-CSF and RANKL or directly from bones, were assessed by reverse transcriptase-polymerase chain reaction. Osteoclasts obtained in vitro from KΔ75 mice expressed almost undetectable levels of cathepsin K and CTR in comparison with WT-derived osteoclasts (left). In contrast, both genes were expressed at the same levels in both KΔ75- and WT-derived bones (right). GAPDH mRNA level was used as an internal control. The results presented here are representative of at least three different experiments.
Figure 8
Figure 8
Differentiation of Flt3L-amplified cells in monocytic lineages. Bone marrow cells from control or KΔ75 mice were amplified in vitro in Flt3L for 6 to 11 days and differentiated as indicated below. A: For macrophage differentiation, Flt3L-amplified cells were cultured in the presence of M-CSF for 5 days and their ability to phagocyte latex beads was evaluated (dots in the cytoplasm). B: For DC differentiation, Flt3L-amplified cells were cultured in the presence of GM-CSF plus tumor necrosis factor-α for 6 days. The expression of the MHC II and CD40 antigen was evaluated by flow cytometry. C: For osteoclast differentiation, Flt3L-amplified cells were cultured in the presence of M-CSF plus RANKL for 6 days. The presence of osteoclasts was evaluated by TRAP staining and cell morphology (number of nuclei). Arrows point to osteoclasts. D: For microglial cell differentiation, bone marrow cells, amplified with Flt3L for 11 days, were cultured in the presence of GCCM. After 4 days of culture, ramified cells, defined as cells displaying at least one process three times longer than the cell body diameter, were very sparse in cultures derived from KΔ75 mice whereas they represented more than 20% of cells in cultures derived from WT mice. The results presented here are representative of at least three different experiments.

References

    1. Olcese L, Cambiaggi A, Semenzato G, Bottino C, Moretta A, Vivier E. Human killer cell activatory receptors for MHC class I molecules are included in a multimeric complex expressed by natural killer cells. J Immunol. 1997;158:5083–5086. - PubMed
    1. Lanier LL, Corliss BC, Wu J, Leong C, Phillips JH. Immunoreceptor DAP12 bearing a tyrosine-based activation motif is involved in activating NK cells. Nature. 1998;391:703–707. - PubMed
    1. Tomasello E, Blery M, Vely F, Vivier E. Signaling pathways engaged by NK cell receptors: double concerto for activating receptors, inhibitory receptors and NK cells. Semin Immunol. 2000;12:139–147. - PubMed
    1. Moretta A, Bottino C, Vitale M, Pende D, Cantoni C, Mingari MC, Biassoni R, Moretta L. Activating receptors and coreceptors involved in human natural killer cell-mediated cytolysis. Annu Rev Immunol. 2001;19:197–223. - PubMed
    1. Diefenbach A, Tomasello E, Lucas M, Jamieson AM, Hsia JK, Vivier E, Raulet DH. Selective associations with signaling proteins determine stimulatory versus costimulatory activity of NKG2D. Nat Immunol. 2002;3:1142–1149. - PubMed

Publication types

MeSH terms

Substances