. 2005 Jan 5;25(1):42-51.
doi: 10.1523/JNEUROSCI.3154-04.2005.

Protons trap NR1/NR2B NMDA receptors in a nonconducting state

Affiliations

Protons trap NR1/NR2B NMDA receptors in a nonconducting state

Tue G Banke et al. J Neurosci. .

Abstract

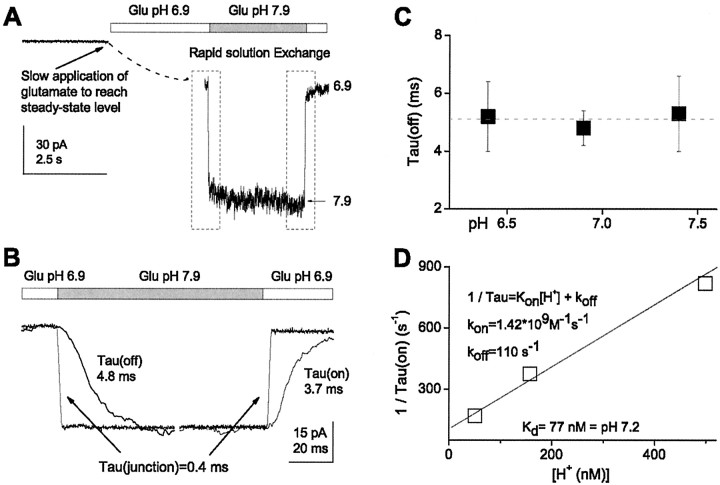
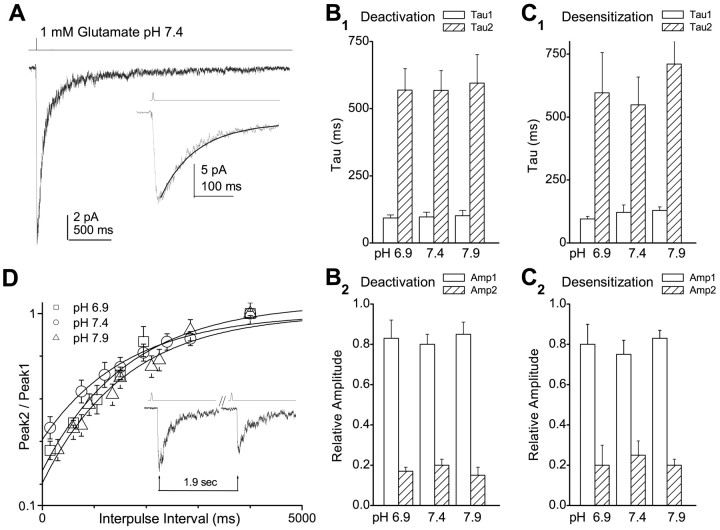
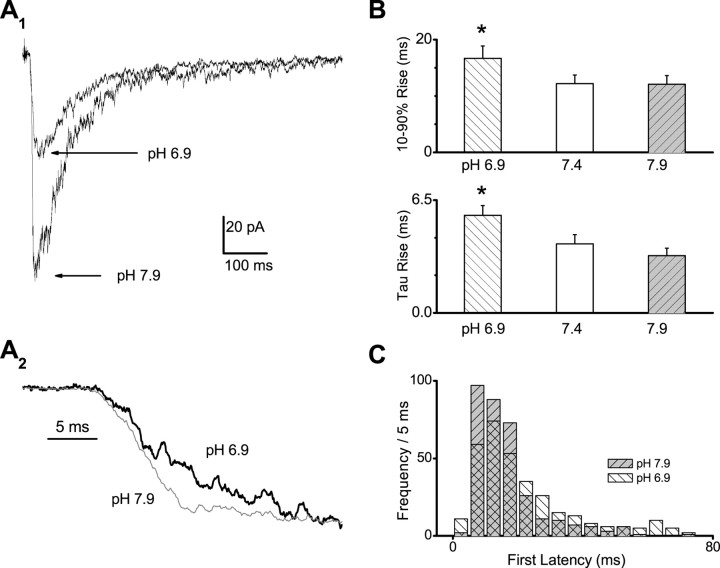
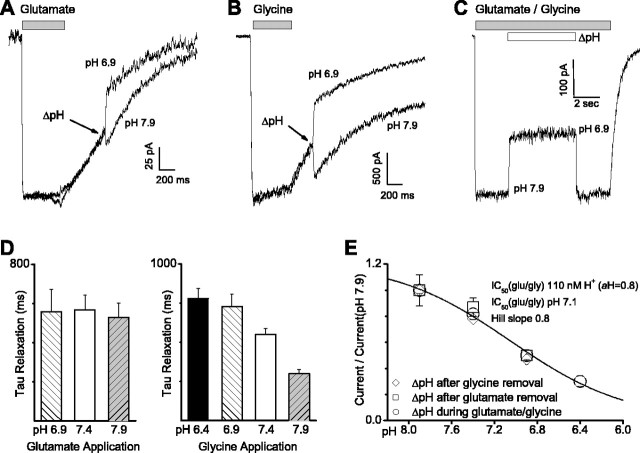
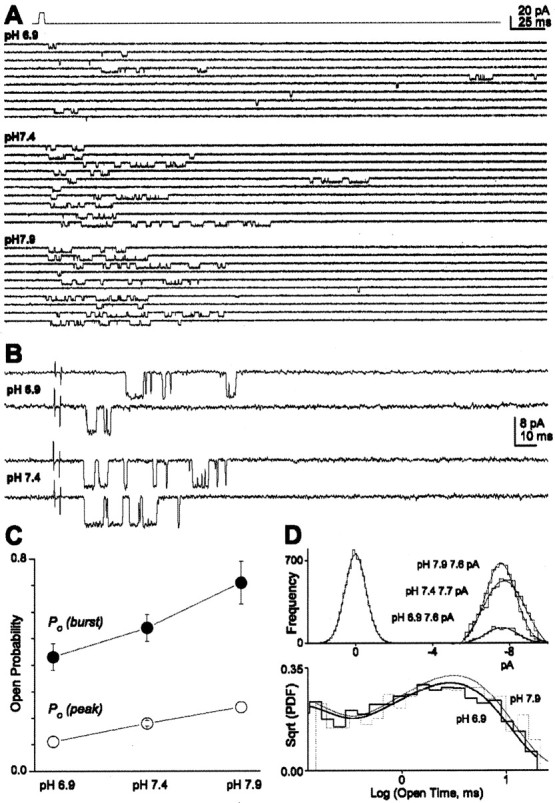
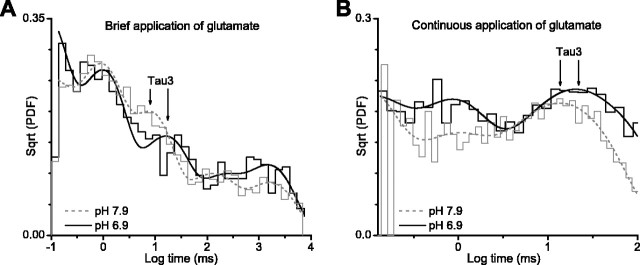
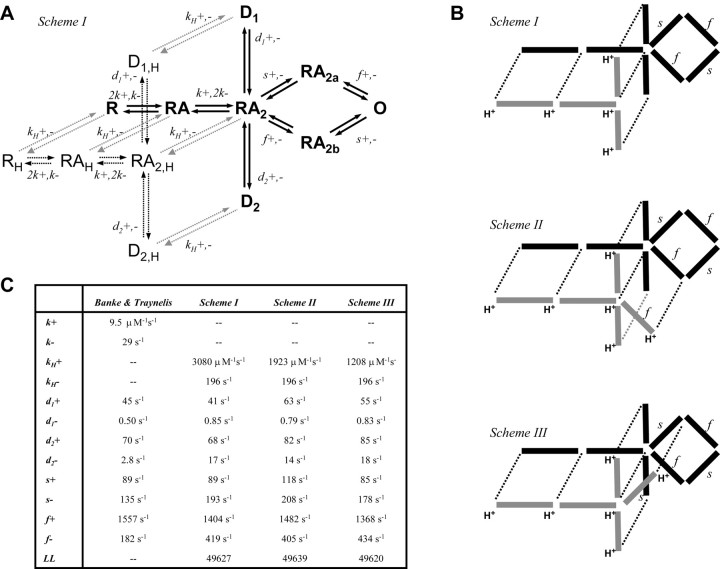
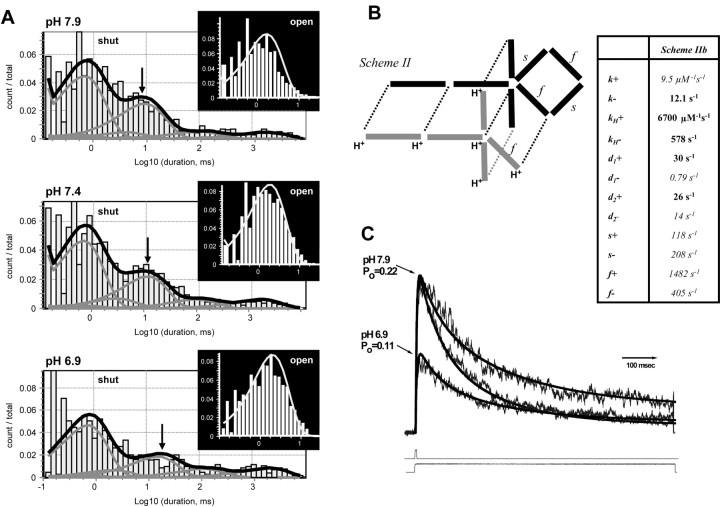
NMDA receptors are highly expressed in the CNS and are involved in excitatory synaptic transmission, as well as synaptic plasticity. Given that overstimulation of NMDA receptors can cause cell death, it is not surprising that these channels are under tight control by a series of inhibitory extracellular ions, including zinc, magnesium, and H+. We studied the inhibition by extracellular protons of recombinant NMDA receptor NR1/NR2B single-channel and macroscopic responses in transiently transfected human embryonic kidney HEK 293 cells using patch-clamp techniques. We report that proton inhibition proceeds identically in the absence or presence of agonist, which rules out the possibility that protonation inhibits receptors by altering coagonist binding. The response of macroscopic currents in excised patches to rapid jumps in pH was used to estimate the microscopic association and dissociation rates for protons, which were 1.4 x 10(9) m(-1) sec(-1) and 110-196 sec(-1), respectively (K(d) corresponds to pH 7.2). Protons reduce the open probability without altering the time course of desensitization or deactivation. Protons appear to slow at least one time constant describing the intra-activation shut-time histogram and modestly reduce channel open time, which we interpret to reflect a reduction in the overall channel activation rate and possible proton-induced termination of openings. This is consistent with a modest proton-dependent slowing of the macroscopic response rise time. From these data, we propose a physical model of proton inhibition that can describe macroscopic and single-channel properties of NMDA receptor function over a range of pH values.


Figures

Figure 4.
Figure 4.
Proton binding to NR1/NR2B is fast. A, B, Macroscopic current response in outside-out patches that were slowly lifted into the solution stream (1 mm glutamate and 20 μm glycine, pH 6.9) and then rapidly moved into solution with different pH. The rising and falling phase of the current response after rapid pH jumps were each fitted to a monoexponential function. τon and τoff for solution exchange junction potential determined after each experiment were on average 0.4 msec. C, τoff is independent of pH. D, The reciprocal of the mean τon is plotted as a function of proton concentration (calculated using an activity coefficient of 0.8). The data were fitted with the following linear equation: 1/τon = kon [H+] + koff. Fitted values for kon and koff were 1.42 × 10⁹ m-1 sec-1 and 110 sec-1, which give a Kd value of 77 nm, corresponding to pH 7.2.
Figure 1.
Figure 1.
Proton inhibition of NR1/NR2B does not reflect enhanced desensitization or deactivation. A, An outside-out patch from HEK 293 cells expressing NR1/NR2B channels were stimulated with a 1-4 msec pulse of 1 mm glutamate (top trace). The average response from 10 trials for a patch that contained multiple channels is shown. The decay phase of the average of 5-10 sweeps was fitted with a two-component exponential equation (solid line in inset): amplitude = AFAST exp(-time/τFAST) + ASLOW exp(-time/τSLOW) + offset. B, C, τ values (mean ± SEM) and respective relative amplitudes for deactivation and desensitization are shown as a function of pH. No significant differences were observed for either deactivation or desensitization parameters (ANOVA). D, Multi-channel patches were stimulated with a double-pulse protocol at three different pH values (triangles, pH 7.9; circles, pH 7.4; squares, pH 6.9). The average ratio of amplitudes across all patches was fitted by a single-exponential component Peak2/Peak1 = {1-ARECOV exp(-time/τRECOV)}. τRECOV for pH 6.9, 7.4, and 7.9 was 1.9, 1.6, and 1.6 sec, respectively. The inset shows average of 10 responses recorded with a 1.9 sec interstimulus interval from one patch.
Figure 2.
Figure 2.
NR1/NR2B response rise time is pH dependent. A, The average NR1/NR2B response from a patch that was stimulated with a 1-4 msec pulse of 1 mm glutamate at pH 6.9 and 7.9. The rising phase of the average of responses is shown on an expanded scale below. B, The average rise time significantly varied as a function of pH (p < 0.02; paired t test between pH 7.4 and 6.9). Five to 10 sweeps were averaged from each of six to eight patches. The average time constant describing an exponential equation fitted to the rising phase was also significantly slowed at pH 6.9 compared with pH 7.4 and 7.9 (ANOVA; Tukey's test; p < 0.018). C, The first-latency histogram from patches that contained a single active channel revealed that the slowing of the rise time at pH 6.9 in part reflects a delay in channel opening.
Figure 3.
Figure 3.
Proton inhibition of NR1/NR2B does not reflect block of ligand binding. A, Whole-cell current responses of HEK 293 cells expressing NR1/NR2B are shown in response to application of 100 μm glutamate (bar); 20 μm glycine was present in all solutions. During the current relaxation after glutamate removal, the extracellular solution was rapidly switched to one of identical composition, except that pH was either 7.9 or 6.9. A rapid increase or decrease in current amplitude was observed when pH was changed to pH 7.9 or 6.9, respectively. B, Similar results were obtained when cells were bathed in the continuous presence of 100 μm glutamate and NR1/NR2B responses were stimulated by application of 20 μm glycine. During the current relaxation after glycine removal, fast solution exchange was performed into pH 7.9 and 6.9. C, The NR1/NR2B whole-cell current response is shown for changes in extracellular pH during coapplication of glutamate and glycine. For all experiments, holding potential was -60 mV. D, The decay phase after ΔpH from traces shown in A and B were fitted by a single-exponential function. Mean τ values are shown. E, Composite concentration-response curves are shown for the effects of pH on current amplitude for each of the three different experimental protocols. IC50 values ranged between pH 6.9 and 7.1; the Hill slope ranged between 0.8 and 1.0.
Figure 5.
Figure 5.
Proton binding decreases NR1/NR2B open probability. A, B, Patches were pulled from HEK 293 cells expressing NR1/NR2B and stimulated with a brief (1-4 msec) 1 mm glutamate pulse (top) at pH 7.9, 7.4, and 6.9, as indicated. All responses in A and B are from the same patch, which contained only a single active channel. Responses in B are shown on an expanded time scale. C, Peak open probability, Po(peak), was calculated at each pH by averaging all traces and then dividing by the measured unitary current amplitude (VHOLD, -100 mV). Probability that agonist binding induces a burst, Po(burst), was defined as the proportion of binding events that lead to at least one channel activation and similarly varied with pH. Only patches with one active channel were analyzed; a subset (n = 6) of the patches at pH 7.4 (n = 10) were also described by Banke and Traynelis, 2003. D, Top, The same conductance level was observed at the three pH values tested under our recording conditions (see Materials and Methods). The results are shown for the patch in A as an all-points histogram. The average chord conductance at -100 mV was 68 ± 4.1 pS (pH 6.9), 72 ± 5.2 pS (pH 7.4), and 75 ± 5.8 pS (pH 7.9; n = 4-5; p = 0.640; ANOVA). Bottom, Open-time histograms for the patch in A [square root of the probability density function, or Sqrt(PDF)] from brief concentration jump experiments at pH 7.9 (809 events) and 6.9 (759 events) are superimposed. Fitted time constants for this histogram were τfast 77, 81 μsec (area 34, 26%) and τslow 2.9, 3.3 msec for pH 6.9 and 7.9, respectively.
Figure 6.
Figure 6.
Protonation of NR1/NR2B channels alters the shut-time histogram. A, Outside-out patches containing NR1/NR2B receptor channels were stimulated with brief 1-8 msec pulses (patches contained 1 active channel) of 1 mm glutamate at pH 6.9 and 7.9; glycine at 20 μm was present in all solutions. Composite shut-time distributions [square root of the probability density function, or Sqrt(PDF)] from 10 (pH 6.9) and 5 (pH 7.9) patches in response to rapid glutamate application were fitted with five exponential components (for values, see Table 3). B, Glutamate at 1 mm (20 μm glycine) was continuously applied to patches that contained one to two active channels at pH 6.9 and 7.9. Composite shut-time distributions from 10 (pH 6.9) and 6 (pH 7.9) patches in response to rapid application were fitted with five exponential components (for values, see Table 3). The longest shut-time components, which contain closed periods during which receptors in desensitized state(s) as well as periods intervening between opening of two independent channels, are not shown. Arrows illustrate pH-dependent changes in the intermediate τ3. A resolution of 100 μsec was imposed on the data, which was digitized at 13-40 kHz (5 kHz filter, -3 dB).
Figure 7.
Figure 7.
A physical model of pH inhibition of the NR1/NR2B NMDA receptor. A, Each NMDA receptor complex is assumed to contain two NR1 and two NR2 subunits, as described by Banke and Traynelis (2003). Each subunit can independently bind either glycine (NR1) or glutamate (NR2); only glutamate binding is shown. We assume that the glycine site is fully saturated. A model illustrating this gating scheme contains a loop, which allows two conformational changes to proceed in any order in which RA2a and RA2b indicates closed receptors that have undergone either the slow (NR2 subunit-dependent) or fast (NR1 subunit-dependent) conformational change, respectively. Two desensitized states are added, as predicted by the dual-exponential time course of current response to prolonged agonist application. B, Three different schemes are shown in which the protonated receptor can proceed with no pregating steps (scheme I), only the fast pregating step (scheme II), or only the slow pregating step (scheme III). All rate constants in the protonated receptor are identical to the corresponding rate constant in the unprotonated receptor. C, Maximum likelihood fits of each model to the sequence of open and closed receptors determined at three different pH values suggested that scheme II best describes the data. All proton association and dissociation rates throughout the model are the same. The proton dissociation rate was fixed to be 196 sec-1, and thus all models have nine free parameters. Fitting omitted glutamate and glycine binding steps.
Figure 8.
Figure 8.
Fitting physical models of H+ inhibition of NR1/NR2B receptors to single-channel and macroscopic data. A, Theoretical shut- and open-time probability density function predicted by maximum likelihood fit of scheme II to the sequence of open and closed events for all patches at three pH values are superimposed on histograms generated from data. Arrows show shift in τ3 describing the shut-time distribution. B, Schematic illustration of the connectivity of the various states in the receptor for scheme IIb. Values to the right are rate constants obtained by least-squares fitting of the current model to a series of macroscopic recordings obtained at pH 6.9 and 7.9 in response to maximal concentrations of glutamate applied for brief (1-8 msec) and long (>1 sec) duration. Five parameters (in bold) were allowed to vary. Others were set to those determined by maximum likelihood fitting (Fig. 7, Scheme II). C, Macroscopic currents predicted from the fitted rate constants are superimposed on the data set.

References

    1. Agmon N (1995) The Grotthus mechanism. Chem Phys Lett 244: 456-462.
    1. Akeson M, Deamer DW (1991) Proton conductance by the gramicidin water wire. Model for proton conductance in the F1F0 ATPases? Biophys J 60: 101-109. - PMC - PubMed
    1. Balestrino M, Somjen GG (1988) Concentration of carbon dioxide, interstitial pH and synaptic transmission in hippocampal formation of the rat. J Physiol (Lond) 396: 247-266. - PMC - PubMed
    1. Banke TG, Traynelis SF (2003) Activation of NR1/NR2B NMDA receptors. Nat Neurosci 6: 144-152. - PubMed
    1. Banke TG, Bowie D, Lee H, Huganir RL, Schousboe A, Traynelis SF (2000) Control of GluR1 AMPA receptor function by cAMP-dependent protein kinase. J Neurosci 20: 89-102. - PMC - PubMed

Publication types

LinkOut - more resources