. 2005 Feb;76(2):312-26.
doi: 10.1086/427762. Epub 2005 Jan 4.

High-resolution mapping of genotype-phenotype relationships in cri du chat syndrome using array comparative genomic hybridization

Affiliations

High-resolution mapping of genotype-phenotype relationships in cri du chat syndrome using array comparative genomic hybridization

Xiaoxiao Zhang et al. Am J Hum Genet. 2005 Feb.

Abstract

We have used array comparative genomic hybridization to map DNA copy-number changes in 94 patients with cri du chat syndrome who had been carefully evaluated for the presence of the characteristic cry, speech delay, facial dysmorphology, and level of mental retardation (MR). Most subjects had simple deletions involving 5p (67 terminal and 12 interstitial). Genotype-phenotype correlations localized the region associated with the cry to 1.5 Mb in distal 5p15.31, between bacterial artificial chromosomes (BACs) containing markers D5S2054 and D5S676; speech delay to 3.2 Mb in 5p15.32-15.33, between BACs containing D5S417 and D5S635; and the region associated with facial dysmorphology to 2.4 Mb in 5p15.2-15.31, between BACs containing D5S208 and D5S2887. These results overlap and refine those reported in previous publications. MR depended approximately on the 5p deletion size and location, but there were many cases in which the retardation was disproportionately severe, given the 5p deletion. All 15 of these cases, approximately two-thirds of the severely retarded patients, were found to have copy-number aberrations in addition to the 5p deletion. Restriction of consideration to patients with only 5p deletions clarified the effect of such deletions and suggested the presence of three regions, MRI-III, with differing effect on retardation. Deletions including MRI, a 1.2-Mb region overlapping the previously defined cri du chat critical region but not including MRII and MRIII, produced a moderate level of retardation. Deletions restricted to MRII, located just proximal to MRI, produced a milder level of retardation, whereas deletions restricted to the still-more proximal MRIII produced no discernible phenotype. However, MR increased as deletions that included MRI extended progressively into MRII and MRIII, and MR became profound when all three regions were deleted.


Figures

Figure  1
Figure 1
Array CGH analysis of patients with cri du chat syndrome. A, Terminal deletion, patient 27. The log2 of the measured ratio is plotted versus the order of clones on chromosome 5p, starting from the telomere at the left. Map positions of the clones are shown in table 3. Data are normalized so that log2ratio = 0 for portions of the genome that contain two copies of each sequence. Error bars, which, in most cases, are the same size as the dots in the figure, indicate the SD of the measurements on the replicate spots for each clone. The deletion boundary occurs between clones 48 and 49. The arrow indicates clone 39 that showed ratios intermediate between normal and deleted in subjects (panel B); deletion included clone 39 but did not include the region around clones 51 and 52. The log2ratio on clone 39, ∼−0.4, is consistent with a deletion from four to three copies of the sequence in that clone, suggesting it is duplicated in the human genome. FISH analysis confirms this duplication, as do some freezes of the human genome sequence. B, Interstitial deletion, patient 114. Clone 39 (arrow) shows an intermediate ratio in this case also. C, Whole-genome analysis of patient 45. The upper panel shows data for the whole genome, with the clones plotted in genomic order. Two small deleted regions, each involving several contiguous clones, are detected. The lower panels show the detailed data, plotted according to sequence position, for chromosomes 5 and 6, which contained the deletions. This array did not include the complete 5p clone set listed in table 3, so that the 5p deletion involves fewer clones than in the high-resolution analysis. The occasional single clones with ratios that differ from 0 either indicate copy-number polymorphisms between the test and reference genomes (Albertson and Pinkel ; Iafrate et al. ; Sebat et al. 2004) or small additional aberrations, noise.
Figure  2
Figure 2
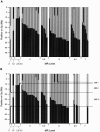
Dependence of MR level on 5p deletion. A, Data from all 91 patients for whom retardation assessment was available. Blackened portions of the bars indicate the chromosomal region(s) that is retained in each case, plotted versus physical position from 5pter. The centromere is just below the bottom of the graph. The dependence of retardation level on deletion is evident, but there are many cases with deletions that appear too small for the general trend. For MR level ⩾5, data are plotted in the order of the proximal deletion boundary within each level. There is an estimated uncertainty of ±0.5–1 in MR-level assignment of retardation phenotype from these severely and profoundly affected patients. B, The same plot for patients in whom we detected only 5p deletions. Note that most of the severely retarded patients are no longer present because they have additional aberrations (fig. 2A). The dependence of retardation on 5p deletion is much more consistent. Three regions of 5p—MRI, MRII, and MRIII—with differential effects on retardation are indicated. These regions are discussed in the text.
Figure  3
Figure 3
Summary of patient data that localize regions of 5p responsible for the cry, facial-dysmorphology, and speech-delay characteristics of the phenotype. Blackened portions of the bars indicate retained regions of the chromosome. The retained clones at the boundaries are indicated (see table 3). A “Y” indicates that the phenotypic characteristic was present in the patient, and an “N” indicates that it was absent. Blackened squares indicate that relevant information was not available for that patient. The circled letters indicate those patients who provide the most informative information on the location of the chromosome portion responsible for that characteristic. The shaded “N” for patient 252 indicates that this patient's deletion should have produced the phenotype by did not.
Figure  4
Figure 4
Summary of genotype-phenotype relationships from our data and data in previous publications. Chromosome bands are indicated relative to the physical map from the July 2003 freeze of the human genome sequence.

References

Electronic-Database Information

    1. Online Mendelian Inheritance in Man (OMIM), http://www.ncbi.nlm.nih.gov/Omim/ (for cri du chat syndrome)
    1. UCSC Genome Bioinformatics, http://genome.cse.ucsc.edu/

References

    1. Albertson DG, Pinkel D (2003) Genomic microarrays in human genetic disease and cancer. Hum Mol Genet 12 (Spec 2):R145–152 - PubMed
    1. Albertson DG, Ylstra B, Segraves R, Collins C, Dairkee SH, Kowbel D, Kuo WL, Gray JW, Pinkel D (2000) Quantitative mapping of amplicon structure by array CGH identifies CYP24 as a candidate oncogene. Nat Genet 25:144–14610.1038/75985 - DOI - PubMed
    1. Church DM, Bengtsson U, Nielsen KV, Wasmuth JJ, Niebuhr E (1995) Molecular definition of deletions of different segments of distal 5p that result in distinct phenotypic features. Am J Hum Genet 56:1162–1172 - PMC - PubMed
    1. Church DM, Yang J, Bocian M, Shiang R, Wasmuth JJ (1997) A high-resolution physical and transcript map of the cri du chat region of human chromosome 5p. Genome Res 7:787–801 - PubMed
    1. Eichler EE (2001) Recent duplication, domain accretion and the dynamic mutation of the human genome. Trends Genet 17:661–66910.1016/S0168-9525(01)02492-1 - DOI - PubMed

Publication types