Comparative Study
. 2005 Jan 18;102(3):673-8.
doi: 10.1073/pnas.0408732102. Epub 2005 Jan 6.

Role of thioredoxin in the response of normal and transformed cells to histone deacetylase inhibitors

Affiliations
Comparative Study

Role of thioredoxin in the response of normal and transformed cells to histone deacetylase inhibitors

J S Ungerstedt et al. Proc Natl Acad Sci U S A. .

Abstract

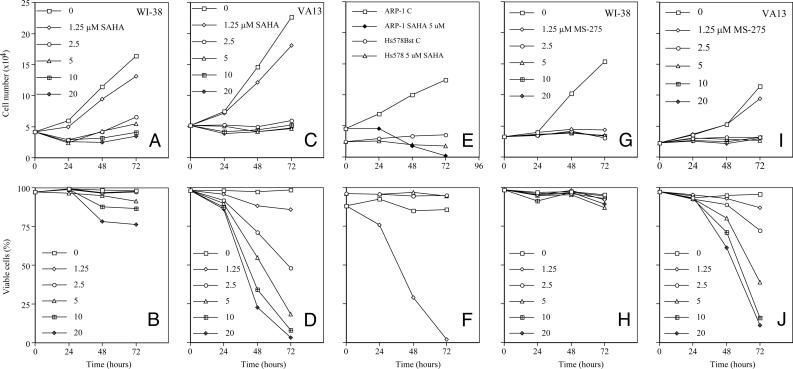
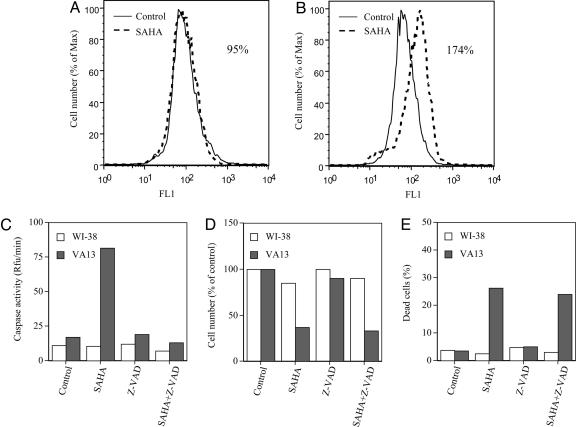
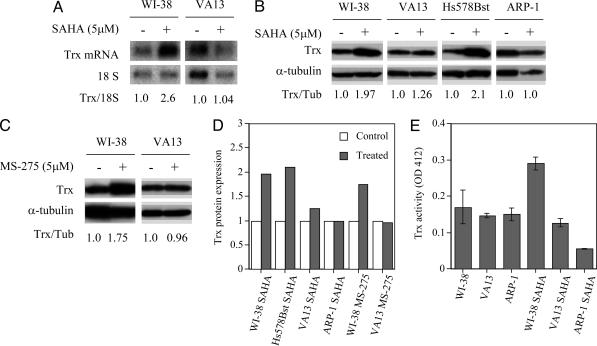
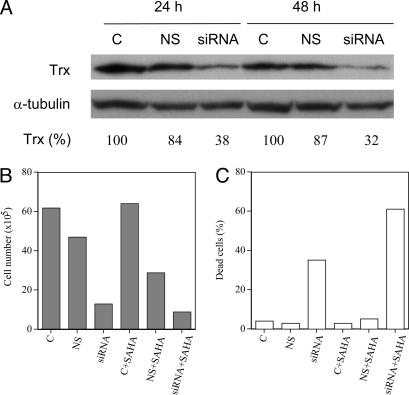
This study examines the basis of resistance and sensitivity of normal and transformed cells to histone deacetylase inhibitor (HDACi)-induced cell death, specifically the role of caspases and thioredoxin (Trx). An important attribute of HDACis is that they induce cancer cell death at concentrations to which normal cells are relatively resistant, making them well suited for cancer therapy. The mechanism underlying this selectivity has not been understood. In this study we found that the HDACi suberoylanilide hydroxamic acid (SAHA) and MS-275, a benzamide, cause an accumulation of reactive oxygen species (ROS) and caspase activation in transformed but not normal cells. Inhibition of caspases does not block HDACi-induced cell death. These studies provide a possible mechanism that can explain why normal but not certain transformed cells are resistant to HDACi-induced cell death. The HDACi causes an increase in the level of Trx, a major reducing protein for many targets, in normal cells but not in transformed cells. The SAHA-induced increase in Trx activity in normal cells is associated with no increase in ROS accumulation. Transfection of transformed cells with Trx small interfering RNA caused a marked decrease in the level of Trx protein with an increase in ROS, a decrease in cell proliferation, and an increase in sensitivity to SAHA-induced cell death. Thus, Trx, independent of the caspase apoptotic pathway, is an important determinant of resistance of cells to HDACi-induced cell death.


Figures

Fig. 1.
Fig. 1.
The effect of HDACi on cell growth and viability of normal and transformed cells in culture. (A and B) The effect of SAHA on the growth (A) and viability (B) of a normal human lung fibroblast WI-38 cell is shown. The cells were cultured without or with SAHA in μM concentrations indicated for 72 h. (C and D) The effect of SAHA on the growth (C) and viability (D) of a SV40-transformed human lung fibroblast, VA13, is shown. (E and F) Cell growth (E) and viability (F) of a normal human breast fibroblast, Hs578Bst, and human multiple myeloma cells, ARP-1, in culture without and with 5 μM SAHA are shown. (G and H) The effect of MS-275 on the growth (G) and viability (H) of WI-38 cells cultured without or with the indicated concentrations of MS-275 for 72 h is shown. (I and J) The effect of MS-275 on the growth (I) and viability (J) of VA13 cells is shown.
Fig. 2.
Fig. 2.
The effect of SAHA on caspase activity, ROS accumulation, cell growth, and viability of WI-38 and VA13 cells. (A and B) Production of ROS in WI-38 cells (A) and VA13 cells (B) cultured without (control) or with 5 μM SAHA for 48 h is shown. ROS values were calculated as the percent mean fluorescence of cells cultured with SAHA compared with that of control cells, i.e., 95% for WI-38 and 174% for VA13 cells. Cells were labeled with oxidative-sensitive dye C-400 and analyzed by flow cytometer for increases in Fl-1 fluorescence. As a control, cells were labeled with C-400 in the presence of 10 μM H2O2. (C) Caspase activity in the WI-38 and VA13 cells cultured without (control) and with 5 μM SAHA, 50 μM Z-VAD-fmk, or 5 μM SAHA plus 50 μM Z-VAD-fmk is shown. (D) Cell growth-expressed percent of control cultures of WI-38 and VA13 cells is shown. (E) Dead cells in WI-38 and VA13 cells cultured without (control) and with 5 μM SAHA, 50 μM Z-VAD-fmk, or 5 μM SAHA plus 50 μM Z-VAD-fmk at 48 h are shown. All determinations were performed in duplicate, and at least two separate studies were performed for each cell line.
Fig. 3.
Fig. 3.
The effect of HDACi on Trx mRNA and protein levels in normal and transformed cells. (A) Trx mRNA levels in WI38 and VA13 cells cultured without or with 5 μM SAHA for 48 h are shown. 18S ribosomal RNA was assayed as a loading control. The number below the gels is the ratio of the density of the Trx mRNA band to the 18S rRNA band relative to that in cells cultured without SAHA, which is set at 1.0. (B) Trx protein levels in WI-38, VA13, Hs578Bst, and ARP-1 cells cultured without or with 5 μM SAHA for 48 h are shown. (C) Trx protein levels in WI-38 and VA13 cells cultured without or with 5 μM MS-275 for 48 h are shown; α-tubulin was assayed in each electrophoresis gel as a loading control. The numbers below the gels are ratios of the density of the Trx protein band to the α-tubulin band relative to that in cells cultured without SAHA, which is set at 1.0. (D) Expression of Trx protein as a ratio of Trx protein/α-tubulin protein relative to that in control (no SAHA or MS-275) set as 1.0 is shown. The expression of Trx protein was consistently higher in normal (WI-38 and Hs578Bst) than in transformed cells after 48 h of culture with SAHA or MS-275 (treated). (E) Trx activity in WI-38, VA13, and ARP-l cells after 48 h of culture without or with 5.0 μM SAHA for WI-38 and V13 cell cultures and 2.5 μM SAHA for ARP-1 cell cultures is shown. The range of three separate determinations is indicated for each bar.
Fig. 4.
Fig. 4.
The effect of transfection on VA13 cells with Trx siRNA. (A) Trx protein levels in VA13 cells, nontransfected (C), transfected with nonspecific siRNA (NS), or transfected with Trx siRNA (siRNA) at 24 h and 48 h in culture (after transfection) are shown. The numbers below the gels represent the Trx band density expressed as a percent of control (set at 100). (B and C) Cell density (B) and dead cells (C) in cultures without or with 1.0 μM SAHA for 48 h are shown.

References

    1. Thornberry, N. A. & Lazebnik, Y. (1998) Science 281, 1312-1316. - PubMed
    1. Jiang, X. & Wang, X. (2004) Annu. Rev. Biochem. 73, 87-106. - PubMed
    1. Rosato, R. R., Almenara, J. A. & Grant, S. (2003) Cancer Res. 63, 3637-3645. - PubMed
    1. Ruefli, A. A., Ausserlechner, M. J., Bernhard, D., Sutton, V. R., Tainton, K. M., Kofler, R., Smyth, M. J. & Johnstone, R. W. (2001) Proc. Natl. Acad. Sci. USA 98, 10833-10838. - PMC - PubMed
    1. Laurent, T. C., Moore, E. C. & Reichard, P. (1964) J. Biol. Chem. 239, 3436-3444. - PubMed

Publication types

MeSH terms

LinkOut - more resources