. 2005 Mar;76(3):387-98.
doi: 10.1086/427925. Epub 2005 Jan 6.

Linkage disequilibrium patterns and tagSNP transferability among European populations

Affiliations

Linkage disequilibrium patterns and tagSNP transferability among European populations

Jakob C Mueller et al. Am J Hum Genet. 2005 Mar.

Abstract

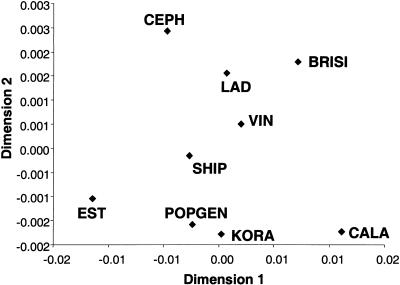
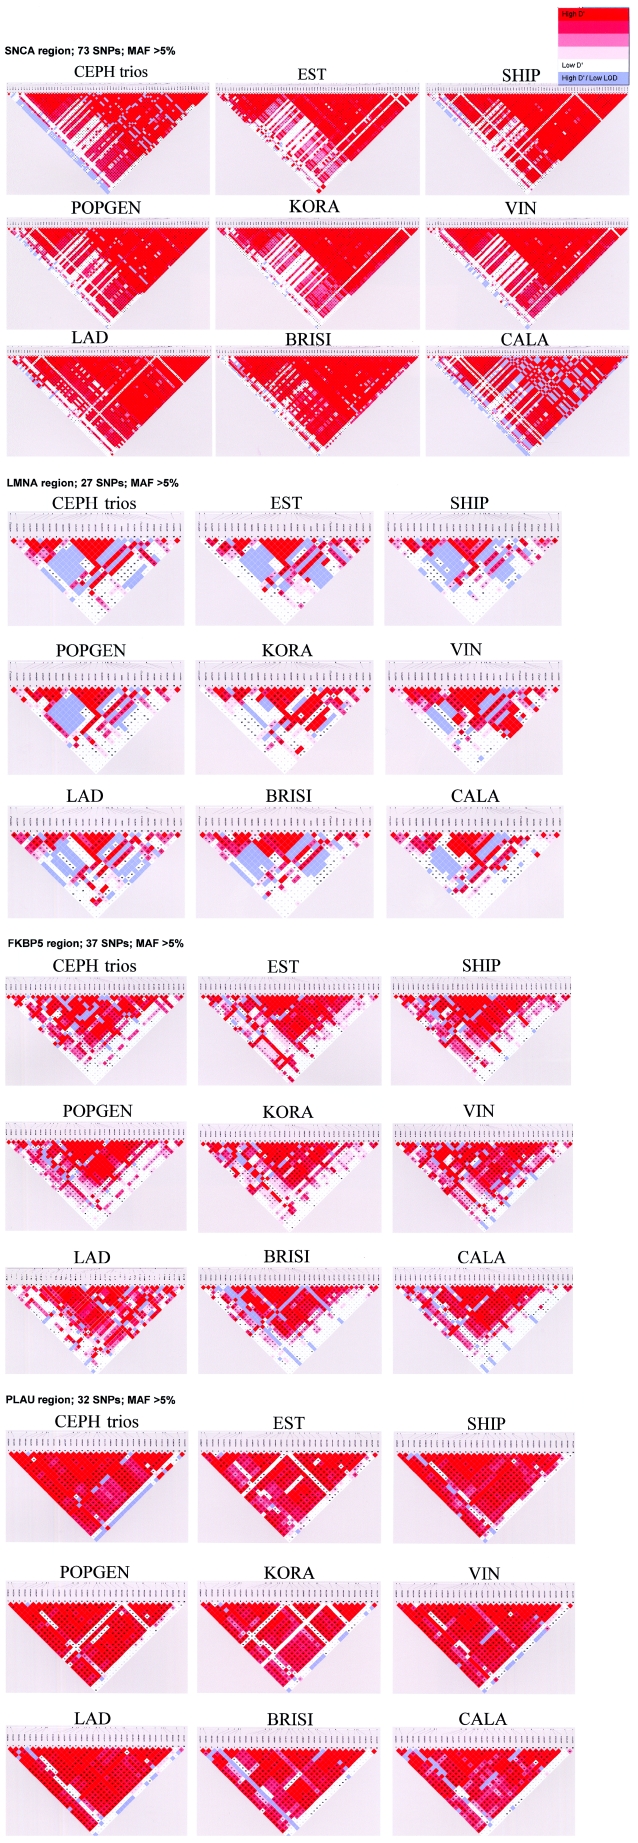
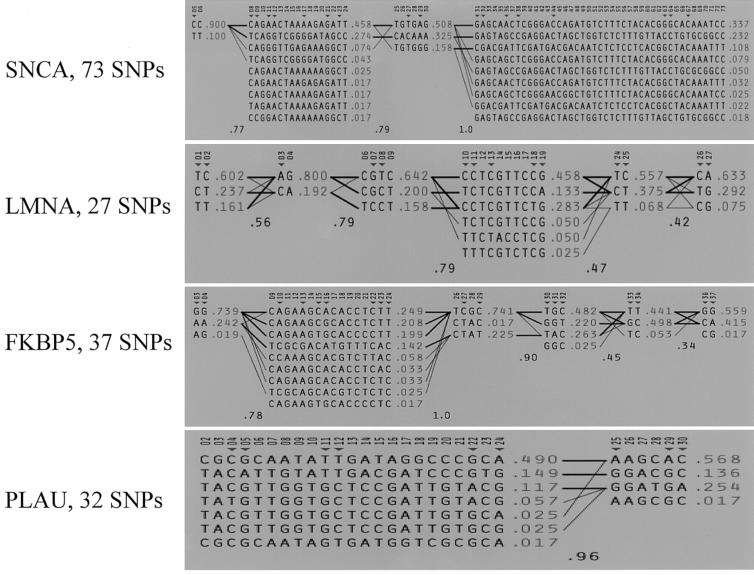
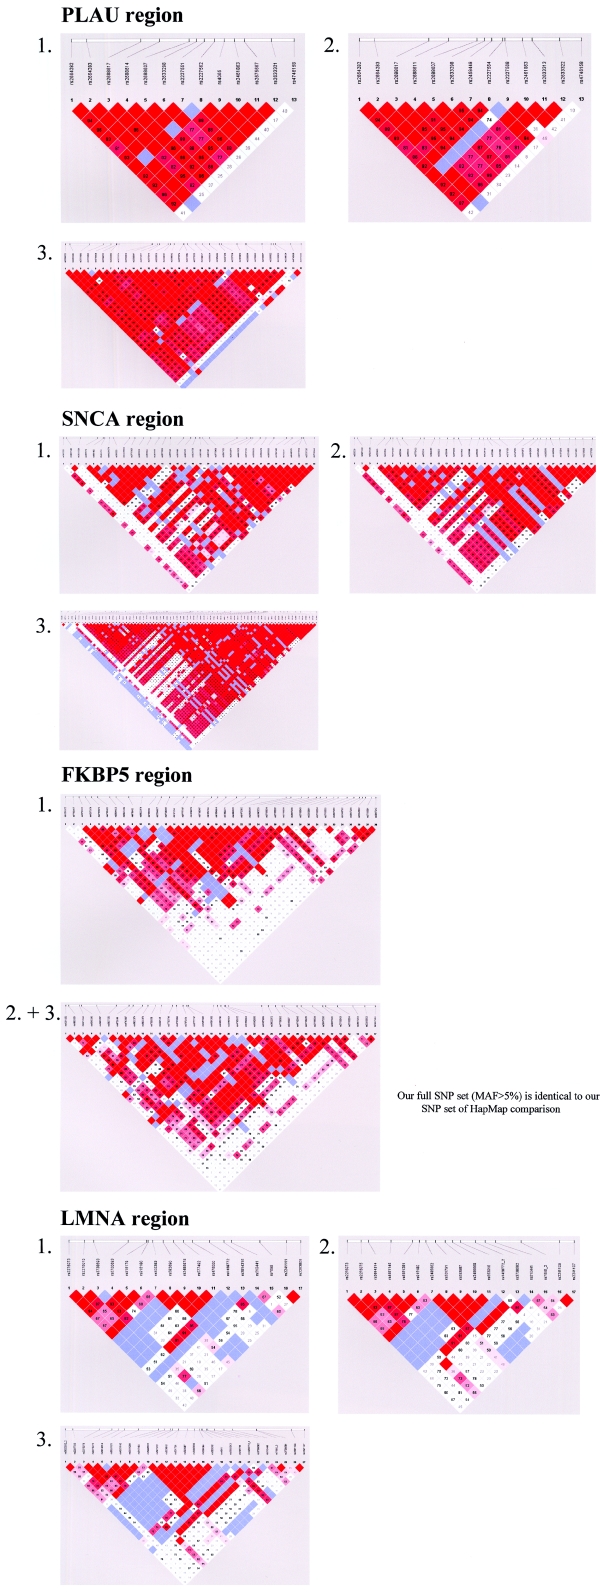
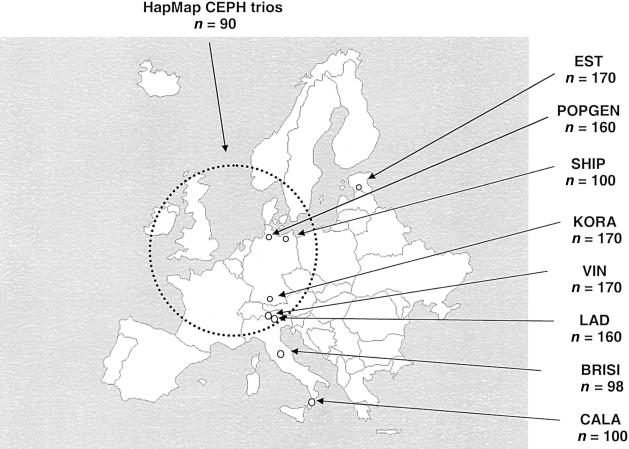
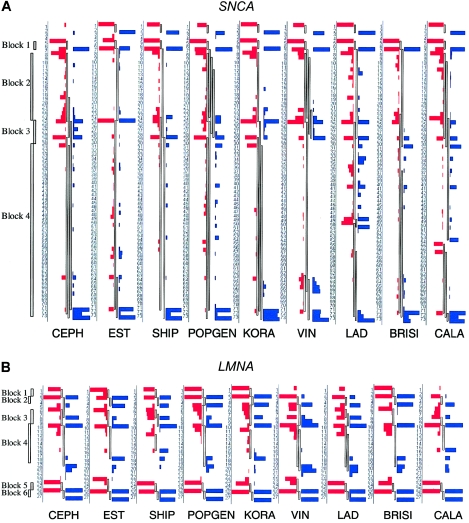
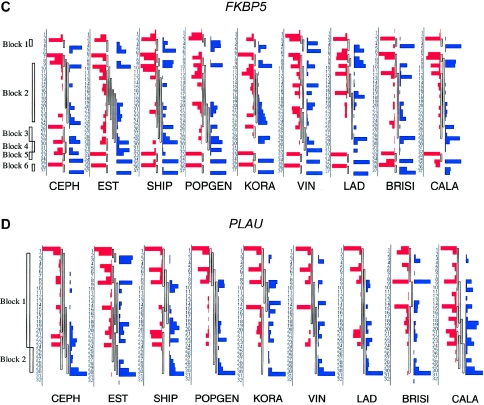
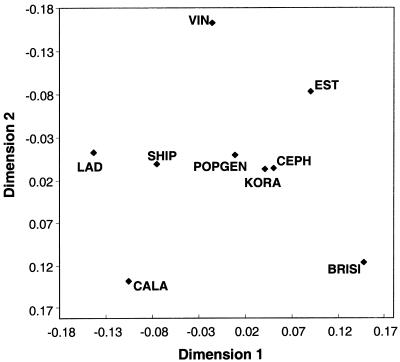
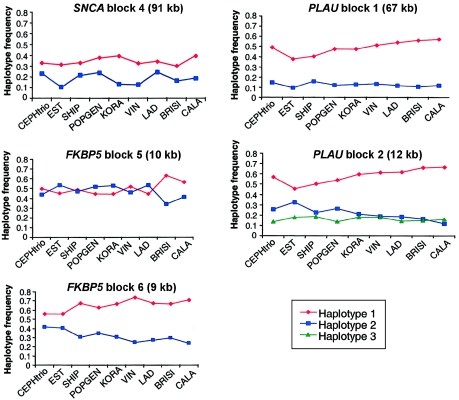
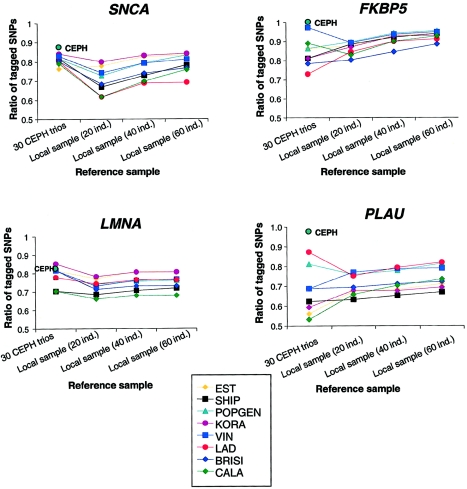
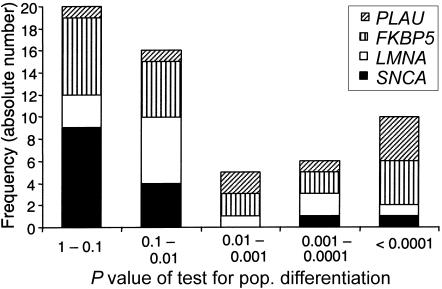
The pattern of linkage disequilibrium (LD) is critical for association studies, in which disease-causing variants are identified by allelic association with adjacent markers. The aim of this study is to compare the LD patterns in several distinct European populations. We analyzed four genomic regions (in total, 749 kb) containing candidate genes for complex traits. Individuals were genotyped for markers that are evenly distributed at an average spacing of approximately 2-4 kb in eight population-based samples from ongoing epidemiological studies across Europe. The Centre d'Etude du Polymorphisme Humain (CEPH) trios of the HapMap project were included and were used as a reference population. In general, we observed a conservation of the LD patterns across European samples. Nevertheless, shifts in the positions of the boundaries of high-LD regions can be demonstrated between populations, when assessed by a novel procedure based on bootstrapping. Transferability of LD information among populations was also tested. In two of the analyzed gene regions, sets of tagging single-nucleotide polymorphisms (tagSNPs) selected from the HapMap CEPH trios performed surprisingly well in all local European samples. However, significant variation in the other two gene regions predicts a restricted applicability of CEPH-derived tagging markers. Simulations based on our data set show the extent to which further gain in tagSNP efficiency and transferability can be achieved by increased SNP density.


Figures

Figure  A1
Figure A1
Multidimensional scaling plot based on Reynold distances (transformed FST values, linearized to population-divergence time). The FST values were calculated from allele frequencies of all four gene regions.
Figure  A2
Figure A2
LD structure (pairwise D′ values) across all nine population samples, with a minor-allele frequency (MAF) >5%.
Figure  A3
Figure A3
Estimated haplotypes with frequency >1% within each block of the four genomic regions for the CEPH trios. Blocks are defined by the standard Gabriel et al. (2002) algorithm (software used was Haploview).
Figure  A4
Figure A4
LD structure in CEPH trios for all four gene regions. For each gene, comparisons of different SNP sets are shown. 1, Original HapMap SNP set. 2, Our SNP set for HapMap comparison. 3, Our full SNP set (minor-allele frequency [MAF] >5%).
Figure  1
Figure 1
Study populations and sample sizes (n)
Figure  2
Figure 2
Bootstrap frequencies of block starts and block ends in all population samples. All samples have an equal population size of 100 individuals (except BRISI, with 98 individuals). SNP markers are ordered vertically by their physical sequence. The length of red or blue bars indicates the bootstrap frequency of block starts or block ends, respectively, at the given position. Between the bars, the observed block structure is shown, with blocks allowed to overlap. To the left of each CEPH graph, the block structure of CEPH is shown, in accordance with the standard algorithm of Gabriel et al. (2002), without allowance for overlapping blocks . An example of a boundary shift can be seen at the end of block 4 in LMNA, which shows clear differences between the populations tested.
Figure  3
Figure 3
Overall similarity of block boundaries across all four gene regions. The first two dimensions, after a multidimensional scaling of the dissimilarity measure of block boundaries, are shown. Sample sizes are adjusted to a size of 100 individuals. The Alpine and geographically peripheral populations (EST, LAD, VIN, BRISI, and CALA) differ the most from all other population samples.
Figure  4
Figure 4
Frequencies of common haplotypes (>10%) in all populations for the five haplotype blocks with significant population differentiation. For block numbers, see figure 2. Populations are arranged on the X-axis in a north-to-south localization. Geographical frequency gradients are prominent in blocks 1 and 2 of PLAU and in block 6 of FKBP5.
Figure  5
Figure 5
Performance of CEPH trios and local samples with different sample sizes used as references for tagSNP definition (by use of the method of Carlson et al. [2004]). The performance criterion shown is the ratio of tagged SNPs above the r2 threshold of 0.8. The tagSNP sets that were defined in the CEPH trios were tested on all populations, whereas the tagSNP sets of local samples were tested only on the same local population. CEPH trios performed relatively well as reference (ratio of tagged SNPs >0.7), except for the PLAU gene region.
Figure  6
Figure 6
Histogram of P values of tests for population differentiation, on the basis of 57 tagSNPs from all gene regions in the CEPH trios. The allele frequencies of most tagSNPs were similar across populations (P>.01). Exceptions were the tagSNPs of the PLAU gene.

References

Electronic-Database Information

    1. GSF European LD Pattern Project, http://ihg.gsf.de/LD/ (for a downloadable version of the genotype data presented in this study)
    1. HapMap Homepage, http://www.hapmap.org/ (for the International HapMap Project)
    1. popgen, http://www.popgen.de/

References

    1. Barbujani G, Sokal RR (1990) Zones of sharp genetic change in Europe are also linguistic boundaries. Proc Natl Acad Sci USA 87:1816–1819 - PMC - PubMed
    1. Cardon LR, Abecasis GR (2003) Using haplotype blocks to map human complex trait loci. Trends Genet 19:135–14010.1016/S0168-9525(03)00022-2 - DOI - PubMed
    1. Carlson CS, Eberle MA, Rieder MJ, Yi Q, Kruglyak L, Nickerson DA (2004) Selecting a maximally informative set of single-nucleotide polymorphisms for association analyses using linkage disequilibrium. Am J Hum Genet 74:106–120 - PMC - PubMed
    1. Cavalli-Sforza LL, Menozzi P, Piazza A (1994) The history and geography of human genes. Princeton University Press, Princeton, NJ
    1. Chapman JM, Cooper JD, Todd JA, Clayton DG (2003) Detecting disease associations due to linkage disequilibrium using haplotype tags: a class of tests and the determinants of statistical power. Hum Hered 56:18–3110.1159/000073729 - DOI - PubMed

Publication types