. 2005 Jan;71(1):85-92.
doi: 10.1128/AEM.71.1.85-92.2005.

Temperature-driven Campylobacter seasonality in England and Wales

Affiliations

Temperature-driven Campylobacter seasonality in England and Wales

Valérie R Louis et al. Appl Environ Microbiol. 2005 Jan.

Abstract

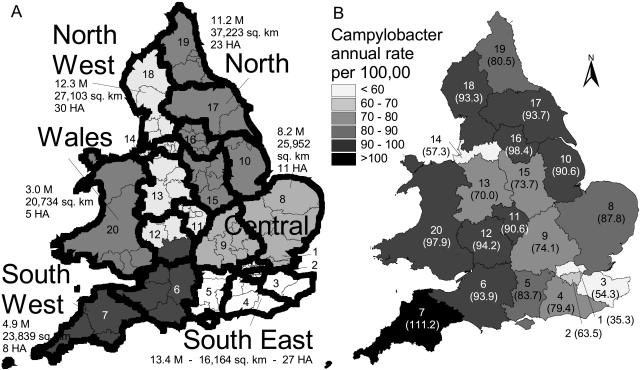
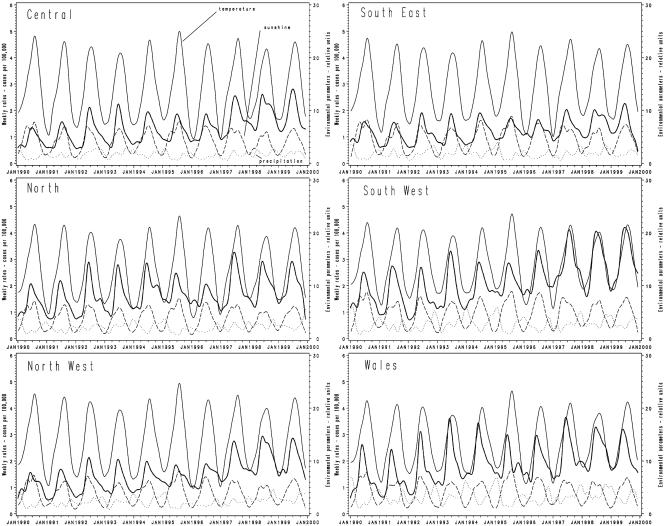
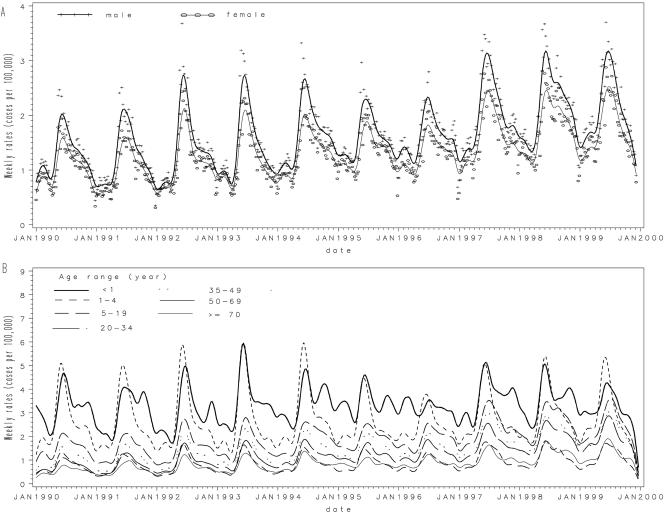
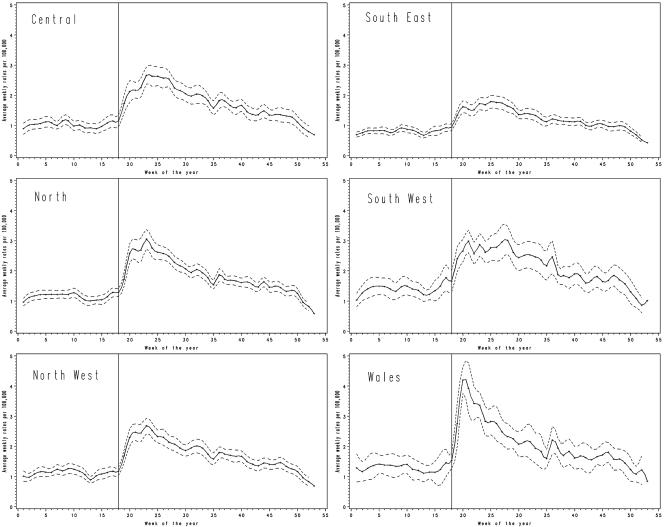
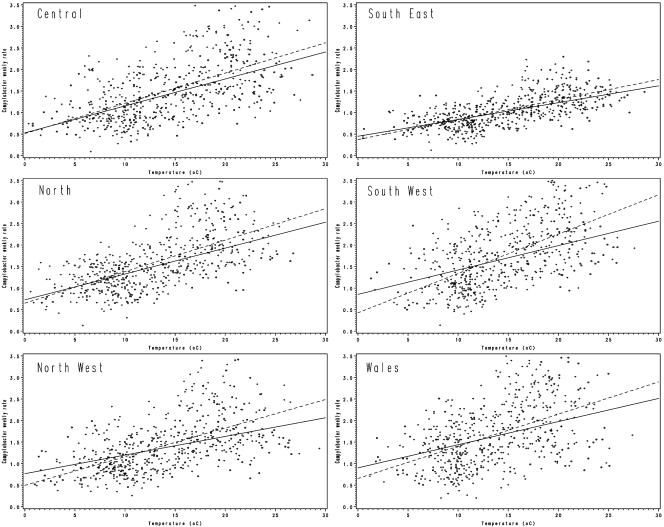
Campylobacter incidence in England and Wales between 1990 and 1999 was examined in conjunction with weather conditions. Over the 10-year interval, the average annual rate was determined to be 78.4 +/- 15.0 cases per 100,000, with an upward trend. Rates were higher in males than in females, regardless of age, and highest in children less than 5 years old. Major regional differences were detected, with the highest rates in Wales and the southwest and the lowest in the southeast. The disease displayed a seasonal pattern, and increased campylobacter rates were found to be correlated with temperature. The most marked seasonal effect was observed for children under the age of 5. The seasonal pattern of campylobacter infections indicated a linkage with environmental factors rather than food sources. Therefore, public health interventions should not be restricted to food-borne approaches, and the epidemiology of the seasonal peak in human campylobacter infections may best be understood through studies in young children.


Figures

FIG. 1.
FIG. 1.
(A) Map of England and Wales showing 104 HAs (thin outlines), 20 numbered districts (thick outline), and 6 regions (gray shading), with corresponding populations in millions for 2000 (40), surface area (in square kilometers), and the number of HAs. Districts: 1, North London; 2, South London; 3, Kent; 4, Surrey and Sussex; 5, Berkshire, Hampshire, and Isle of Wight; 6, Avon, Somerset, Dorset, and Wiltshire; 7, Devon and Cornwall; 8, Essex and East Anglia; 9, central counties; 10, South Humber and Lincolnshire; 11, central Midlands; 12, southwest Midlands and Gloucestershire; 13, northwest Midlands; 14, Greater Liverpool and Manchester; 15, East Midlands; 16, West and South Yorkshire, North Yorkshire, and Lincolnshire; 17, Cumbria and Lancashire; 19, Northeast; 20, Wales. (B) Map of annual campylobacter incidence (annual cases per 100,000) by district, shown with district numbers and, in parentheses, corresponding campylobacter rates.
FIG. 2.
FIG. 2.
Time series of weekly campylobacter incidence (weekly cases per 100,000) and environmental factors, by region. Thick solid line, campylobacter rates per 100,000; thin solid line, temperature; dashed line, precipitation; dotted line, sunshine. Color figures are available at http://www.panix.com/∼vlouis/campy/.
FIG. 3.
FIG. 3.
Time series of campylobacter incidence (weekly cases per 100,000) by gender (A) or by age category (in years) (B). The smooth lines represent spline interpolations. For clarity, original data points (+, ○) are shown only in panel A.
FIG. 4.
FIG. 4.
Campylobacter incidence annual pattern by area. Solid line, average campylobacter rate (weekly cases per 100,000); dotted line, 95% confidence interval around the 10-year mean; vertical line, onset of the annual peak around 1 May.
FIG. 5.
FIG. 5.
Linear regression of weekly campylobacter rates versus average temperature by geographical area. Circle, no rain (<1 mm in the week); +, rain (≥1 mm in the week). The linear regression line is shown for each case (solid and dotted lines, respectively).

References

    1. Adak, G. K., J. M. Cowden, S. Nicholas, and H. S. Evans. 1995. The Public Health Laboratory Service national case-control study of primary indigenous sporadic cases of Campylobacter infection. Epidemiol. Infect. 115:15-22. - PMC - PubMed
    1. Allos, B. M. 2001. Campylobacter jejuni infections: update on emerging issues and trends. Clin. Infect. Dis. 32:1201-1206. - PubMed
    1. Bang, D. D., E. M. Nielsen, K. Knudsen, and M. Madsen. 2003. A one-year study of campylobacter carriage by individual Danish broiler chickens as the basis for selection of Campylobacter spp. strains for a chicken infection model. Epidemiol. Infect. 130:323-333. - PMC - PubMed
    1. Buswell, C. M., Y. M. Herlihy, L. M. Lawrence, J. T. McGuiggan, P. D. Marsh, C. W. Keevil, and S. A. Leach. 1998. Extended survival and persistence of Campylobacter spp. in water and aquatic biofilms and their detection by immunofluorescent-antibody and -rRNA staining. Appl. Environ. Microbiol. 64:733-741. - PMC - PubMed
    1. Buzby, J. C., and T. Roberts. 1997. Economic costs and trade impacts of microbial foodborne illness. World Health Stat. Q. 50:57-66. - PubMed