. 2005 Mar;19(3):440-2.
doi: 10.1096/fj.04-3180fje. Epub 2005 Jan 7.

Green fluorescent protein is a quantitative reporter of gene expression in individual eukaryotic cells

Affiliations

Green fluorescent protein is a quantitative reporter of gene expression in individual eukaryotic cells

Mark R Soboleski et al. FASEB J. 2005 Mar.

Abstract

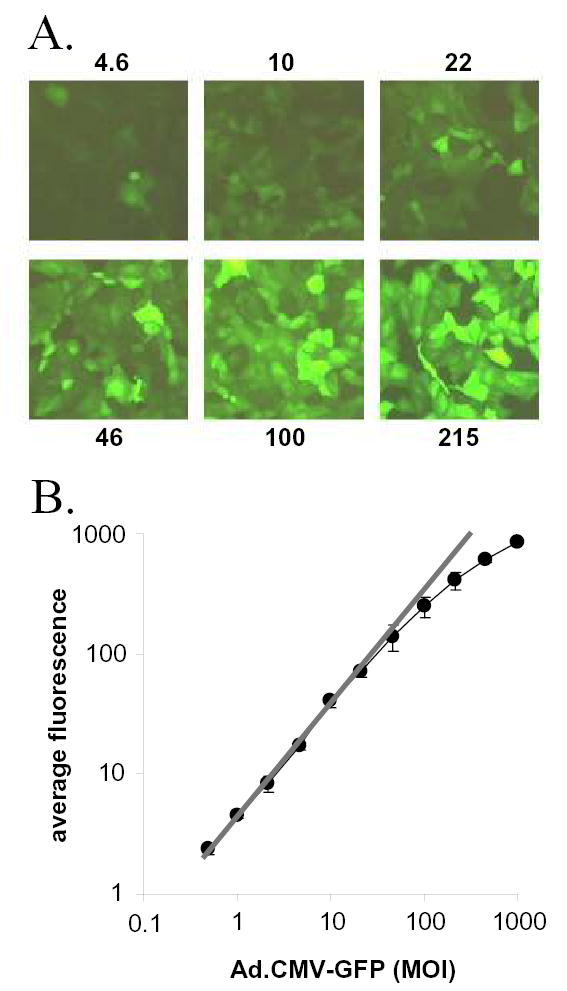
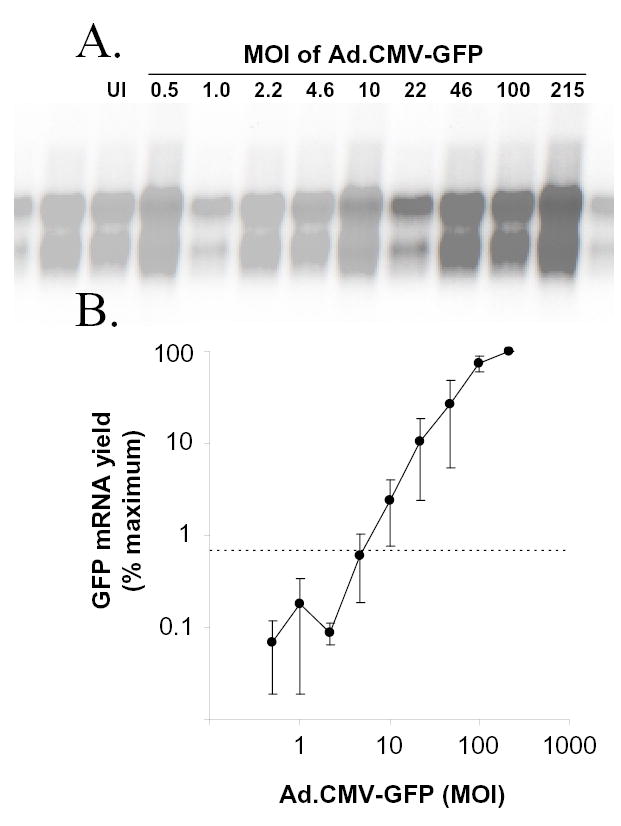
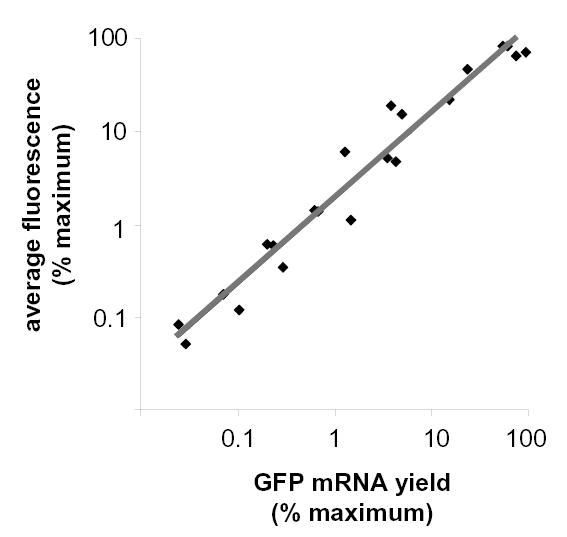
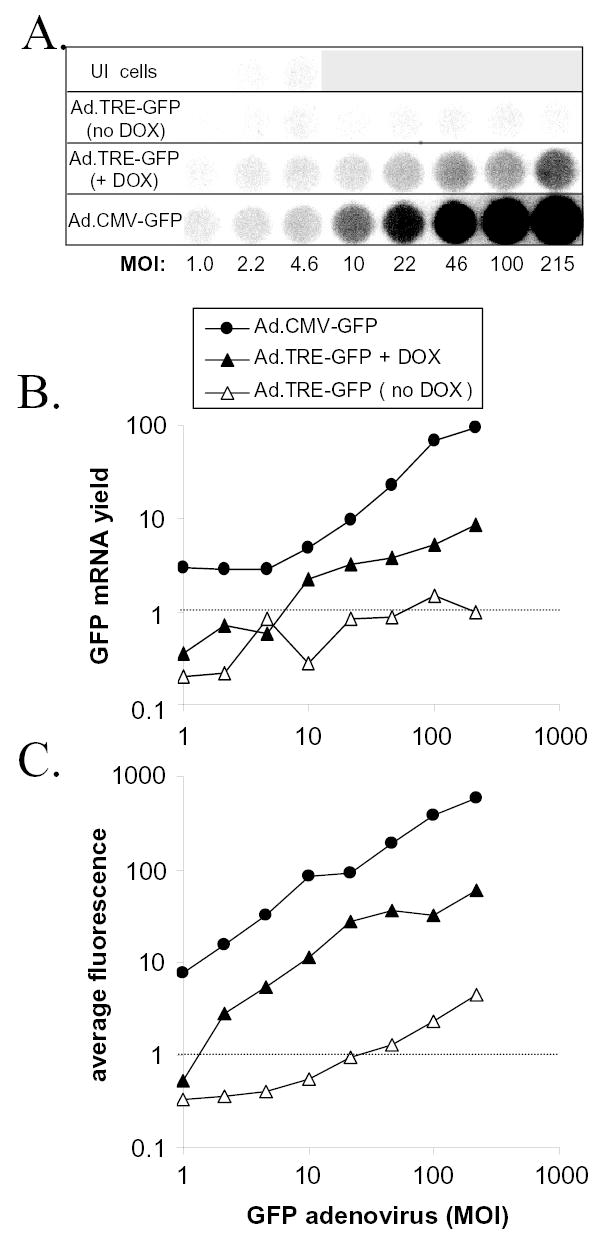
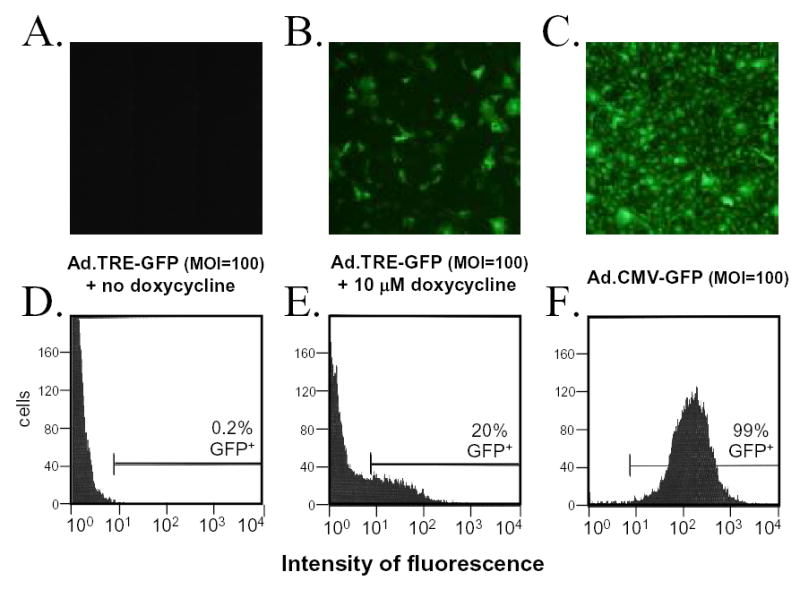
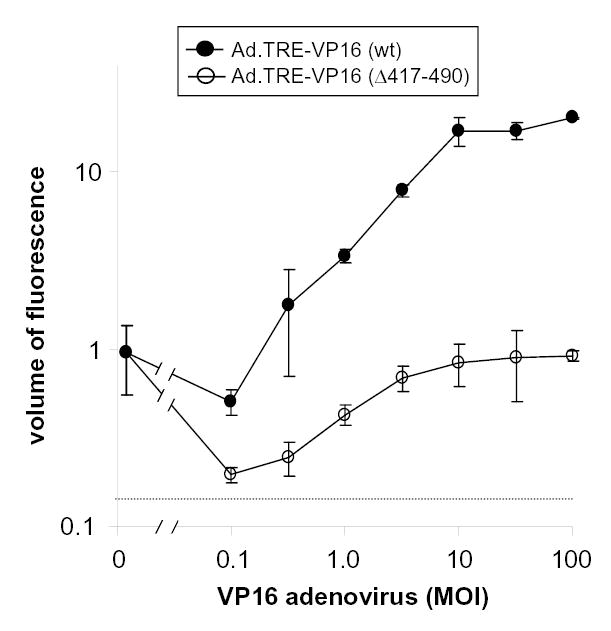
Green fluorescent protein (GFP) has gained widespread use as a tool to visualize spatial and temporal patterns of gene expression in vivo. However, it is not generally accepted that GFP can also be used as a quantitative reporter of gene expression. We report that GFP is a reliable reporter of gene expression in individual eukaryotic cells when fluorescence is measured by flow cytometry. Two pieces of evidence support this conclusion: GFP fluorescence increases in direct proportion to the GFP gene copy number delivered to cells by a replication-defective adenovirus vector, Ad.CMV-GFP, and the intensity of GFP fluorescence is directly proportional to GFP mRNA abundance in cells. This conclusion is further supported by the fact that the induction of GFP gene expression from two inducible promoters (i.e., the TRE and ICP0 promoters) is readily detected by flow cytometric measurement of GFP fluorescent intensity. Collectively, the results presented herein indicate that GFP fluorescence is a reliable and quantitative reporter of underlying differences in gene expression.


Figures

Figure 1
Figure 1. GFP fluorescence increases in proportion to the MOI of Ad.CMV-GFP
A. Vero cell monolayers as seen 24 hours after inoculation with 4.6, 10, 22, 46, 100, or 216 pfu per cell of Ad.CMV-GFP under illumination with 360–400 nm light that excites GFP fluorescence (20x magnification). B. Average GFP fluorescent intensity of Vero cells 24 hours after inoculation with Ad.CMV-GFP is plotted as a function of MOI (n=3 per group; each datum point represents the mean ± SEM). Values of GFP fluorescence are scaled relative to the lower limit of detection of the assay, which was estimated to be three times the average background fluorescence of uninoculated Vero cells. The gray line represents the regression line between average GFP fluorescence and the MOI of Ad.CMV-GFP in the linear range of fluorescence increase between 0.5 and 46 pfu per cell (r2=0.99, as determined by regression analysis).
Figure 2
Figure 2. GFP mRNA yield increases in proportion to the MOI of Ad.CMV-GFP
A. Northern blot of GFP mRNA from uninoculated (UI) Vero cells or Vero cells inoculated with MOIs of 0.5, 1.0, 2.2, 4.6, 10, 22, 46, 100, or 215 pfu per cell of Ad.CMV-GFP. Total RNA samples (10 μg per lane) were harvested 24 hours p.i., electrophoretically separated, blotted, and probed with a 32P-labeled GFP-specific probe. B. GFP mRNA yield observed in three independent Northern blots, including the blot shown in panel A, is plotted as a function of the MOI of Ad.CMV-GFP (each datum point represents the mean ± SEM). For each of the three blots, GFP mRNA yield was normalized to the maximum GFP mRNA yield (i.e., MOI=215), such that the highest yield on each blot was assigned a value of 100% and the other yields were scaled proportionally.
Figure 3
Figure 3. GFP fluorescence is proportional to GFP mRNA yield
The relative level of GFP fluorescence in Ad.CMV-GFP-infected Vero cell cultures is graphed as a function of the relative GFP mRNA yields obtained from the same cultures. Vero cells were inoculated with 2.2, 4.6, 10, 22, 46, 100, 215, or 464 pfu per cell of Ad.CMV-GFP (n=3 replicates per MOI). At 24 hours p.i., 10% of the cells in each culture were used to measure GFP fluorescence via flow cytometry. The remaining 90% of the cells were used to measure GFP mRNA yield via Northern blot analysis. GFP fluorescence and GFP mRNA yields are scaled relative to their respective observed maximums (i.e., MOI = 464), which were assigned a value of 100%. The relative amounts of GFP fluorescence derived from cultures inoculated with MOIs of 2.2 to 215 pfu per cell of Ad.CMV-GFP are plotted as a function of the relative GFP mRNA yield of the same culture. The gray line represents the regression line between normalized measurements of GFP fluorescence and GFP mRNA yield (r2=0.96, as determined by regression analysis).
Figure 4
Figure 4. Doxycycline-induced expression of a TRE promoter-GFP reporter gene
Vero cells were co-inoculated with Ad.CMV-rtTA (MOI=10) and Ad.TRE-GFP (MOI= 1.0, 2.2, 4.6, 10, 22, 46, 100, or 215), and were treated 1 hour later with either nothing (no DOX) or 10 μM doxycycline (+ DOX). As a positive control for GFP expression, Vero cells were inoculated with the same MOIs of Ad.CMV-GFP. At 24 hours p.i., flow cytometric measurement of GFP fluorescence was performed on 10% of the cells in each culture, and the remainder were used to measure GFP mRNA yield via dot blot analysis. A. Hybridization of GFP mRNA-specific probe to dotblots of total RNA (10 μg per well) isolated from Vero cells that were uninoculated (UI), inoculated with Ad.TRE-GFP under non-inducing conditions (no DOX) or inducing conditons (+ DOX), or inoculated with Ad.CMV-GFP. B. GFP mRNA yield and C. GFP fluorescence are plotted as a function of the MOI of Ad.CMV-GFP or Ad.TRE-GFP added to Vero cells. The values of GFP mRNA yield and average GFP fluorescence are scaled in proportion to the lower limit of detection of each assay, which is denoted by a dashed line.
Figure 5
Figure 5. GFP is not uniformly expressed to detectable levels in Vero cells infected with Ad.TRE-GFP
(A – C) Monolayers of adenovirus-infected Vero cells as seen 24 hours p.i. under illumination with 360–400 nm light which excites GFP fluorescence (10x magnification). Vero cells were inoculated with Ad.TRE-GFP (MOI=100) and Ad.CMV-rtTA (MOI=10) and treated with A. no doxycycline or B. 10 μM doxycycline, or C. were inoculated with Ad.CMV-GFP (MOI=100). (D – F) Flow cytometric analysis of Vero cells 24 hours after inoculation with Ad.TRE-GFP and Ad.CMV-rtTA in the D. absence or E. presence of 10 μM doxycycline, or 24 hours after inoculation with F. Ad.CMV-GFP. For each histogram, the threshold between GFP-negative and GFP-positive is indicated, as is the percent of GFP-positive cells in the sample population.
Figure 6
Figure 6. VP16-induced expression of a viral IE promoter-GFP reporter gene
Vero cell monolayers were treated with 10 μM doxycycline following co-inoculation with Ad.CMV-rtTA (MOI=10) and 0.1, 0.3, 1.0, 3.2, 10, 32, or 100 pfu per cell of Ad.TRE-VP16 (wild-type) or Ad.TRE-VP16 (Δ417–490). Vero cells were transfected 24 hours later with 3 μg of p0-GFP, which contains an HSV-1 ICP0 promoter-GFP reporter gene, and Vero cells were harvested 42 hours later for flow cytometric analysis. The GFP fluorescent volume of p0-GFP-transfected cells is plotted as a function of adenovirus MOI (n=3 cultures per MOI; each datum point represents the mean ± SEM). The fluorescent volume of each culture was calculated to be the ‘fraction of GFP+ cells’ times the ‘mean fluorescence of GFP+ cells.’ Fluorescent volumes are normalized to the basal level of GFP expression (i.e., assigned a volume of 1), which was observed in cells transfected with p0-GFP only. The basal level of GFP expression in these cultures that received no adenovirus is shown on the left-hand side of the graph (i.e., MOI=0). The lower limit of detection of the assay, denoted by the dashed line, was estimated to be three times the background fluorescent volume associated with uninoculated Vero cells.

References

    1. Aints A, Dilber MS, Smith CI. Intercellular spread of GFP-VP22. J Gene Med. 1999;1:275–9. - PubMed
    1. Albano CR, Randers-Eichhorn L, Bentley WE, Rao G. Green fluorescent protein as a real time quantitative reporter of heterologous protein production. Biotechnol Prog. 1998;14:351–4. - PubMed
    1. Anderson MT, I, Tjioe M, Lorincz MC, Parks DR, Herzenberg LA, Nolan GP. Simultaneous fluorescence-activated cell sorter analysis of two distinct transcriptional elements within a single cell using engineered green fluorescent proteins. Proc Natl Acad Sci U S A. 1996;93:8508–11. - PMC - PubMed
    1. Baulcombe DC, Chapman S, Santa Cruz S. Jellyfish green fluorescent protein as a reporter for virus infections. Plant J. 1995;7:1045–53. - PubMed
    1. Boes M, Cerny J, Massol R, Op den Brouw M, Kirchhausen T, Chen J, Ploegh HL. T-cell engagement of dendritic cells rapidly rearranges MHC class II transport. Nature. 2002;418:983–8. - PubMed

Publication types

MeSH terms

LinkOut - more resources