. 2005;6(1):R5.
doi: 10.1186/gb-2004-6-1-r5. Epub 2004 Dec 23.

Wound healing and inflammation genes revealed by array analysis of 'macrophageless' PU.1 null mice

Affiliations

Wound healing and inflammation genes revealed by array analysis of 'macrophageless' PU.1 null mice

Lisa Cooper et al. Genome Biol. 2005.

Abstract

Background: Wound healing is a complex process requiring the collaborative efforts of different tissues and cell lineages, and involving the coordinated interplay of several phases of proliferation, migration, matrix synthesis and contraction. Tissue damage also triggers a robust influx of inflammatory leukocytes to the wound site that play key roles in clearing the wound of invading microbes but also release signals that may be detrimental to repair and lead to fibrosis.

Results: To better define key cellular events pivotal for tissue repair yet independent of inflammation we have used a microarray approach to determine a portfolio of over 1,000 genes expressed across the repair response in a wild-type neonatal mouse versus its PU.1 null sib. The PU.1 null mouse is genetically incapable of raising the standard inflammatory response, because it lacks macrophages and functioning neutrophils, yet repairs skin wounds rapidly and with reduced fibrosis. Conversely, by subtraction, we have determined genes that are either expressed by leukocytes, or upregulated by fibroblasts, endothelial cells, muscle cells and others at the wound site, as a consequence of inflammation. To determine the spatial expression pattern for several genes in each cluster we have also performed in situ hybridization studies.

Conclusions: Cluster analysis of genes expressed after wounding wild-type mice versus PU.1 null sibs distinguishes between tissue repair genes and genes associated with inflammation and its consequences. Our data reveal and classify several pools of genes, giving insight into their likely functions during repair and hinting at potential therapeutic targets.


Figures
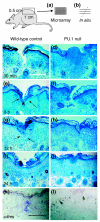
Figure 1
Figure 1
Wound histology. The location of skin wounds on the back of a neonatal mouse is shown. (a) For the array studies a series of criss-cross wounds were made so that all the skin cells were as close as possible to a wound edge for collection of wound RNA. (b) For in situ hybridization studies and immunohistochemistry we made a series of three incisional wounds, so that transverse sections (broken line) contained the profiles of several wounds. Resin histology through wild-type (left-hand column) and PU.1 null wounds (right-hand column) at (c,d) 0.5 h, (e,f) 3 h, (g,h) 12 h and (i,j) 24 h post-wounding. At all stages, arrows mark the epidermal wound edges, which are seen to have met and fused in both genotypes by 24 h. An asterisk (*) marks the migrating epithelial edge. (k,l) In situ hybridization using a macrophage-specific C-fms probe reveals large numbers of macrophages recruited to the granulation tissue in frozen sections through 24 h wounds in wild-type skin (k), while none are present in equivalent tissues of the PU.1 null mouse (l). Scale bars = (c-j) 400 μM; (k,l) 250 μM.
Figure 2
Figure 2
Median temporal profile graphs of identified repair and inflammation clusters. Line graphs displaying the median level of absolute mRNA expression (y-axis) at each time point: 0, 0.5, 3, 12 and 24 h (x-axis), for genes within each of the four repair clusters and the three inflammation clusters, giving representative temporal profiles for the cluster. Pink lines represent the temporal profiles of expression for the PU.1 null wound site, blue lines those for the wild-type wound site. (a-d) The inflammation-independent gene clusters: (a) activation; (b) early effector; (c) late effector; (d) stop. (e-g) The inflammation-dependent clusters: (e) early inflammatory; (f) late inflammatory; (g) inflammation-maintained. The scale of absolute expression levels along the y-axis varies according to the maximum levels of expression in each cluster.
Figure 3
Figure 3
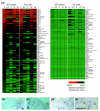
Heatmaps for activation and effector clusters. Color depiction of the temporal profiles of mRNA intensity during the 24 h repair period for genes in (a) the activation cluster, (b) the early effector cluster and (c) the late effector cluster. Higher levels of expression are indicated by progressively brighter shades of red, and lower expression levels by increasingly brighter shades of green. The scale bar indicates absolute expression as a measure of fluorescence units. Genes are ordered with the most highly expressed first. Gene names are shown to the right of the maps and further bioinformatics data for each can be found in Additional data file 1. Expression levels for the PU.1 null wound site at 0, 0.5, 3, 12 and 24 h are shown on the right and the equivalent expression levels for the wild-type (WT) wounds on the left.
Figure 4
Figure 4
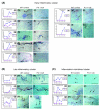
Temporal and spatial expression profiles of sample genes from the activation and effector clusters. Temporal and spatial profiles of the (a-h) activation and (i-p) effector clusters. The line graphs display temporal expression: absolute expression levels (y-axis) at each time point (x-axis) with both PU.1 null (pink) and wild-type profiles (blue). The y-axis range varies depending on the expression levels for each gene. The photomicrographs show in situ hybridization on 3 h (b,d,f,h) and 12 or 24 h (j,l,n,p) frozen wild-type wounds. (a,c,e,g) Temporal profiles of each of the activation genes show a rapidly induced but transient expression peak at 3 h in both PU.1 null and wild-type wounds. (b) Krox24 is expressed by wound margin epidermal cells extending back 10-12 cell diameters from the wound edge and also by associated hair follicles (arrows). (d) MKP-1 is expressed by the first 5-8 front-row keratinocytes and a subset of dermal fibroblasts (arrows). (f) High levels of Fosl1 expression in wound margin epidermal cells and weaker expression in damaged hair follicles (arrows). (h) EST GenBank accession number AI853531 appears to be expressed by wound fibroblasts (arrows). (i,k,m,o) The early and late effector gene samples all exhibit expression profiles with upregulation either at 12 h (i,k), or 24 h (m,o), whether in PU.1 null or wild-type wound tissues. (j) Map4k4 is expressed up to 10-12 cell diameters from the wound edge and in dermal fibroblasts (arrows). (l) Rbp1 is expressed in epidermal cells approximately 15 cell diameters from the wound site. (n) K6 expression is restricted to 10-12 rows of wound edge keratinocytes. (p) MRP8 has a rather similar keratinocyte expression to K6, but is also expressed to a lesser extent in leukocytes in wild-type wounds (arrows). Scale bar = 400 μm.
Figure 5
Figure 5
Heatmap and in situ hybridization data for genes in the stop cluster. (a) The temporal expression profiles of genes of the cluster are represented by a heatmap. The highest levels of expression are indicated by the brightest shades of red, while lower expression levels are represented by progressively brighter shades of green, as indicated by the scale bar. Genes are ordered with the most highly expressed first, and gene names are shown to the right of the maps. (b-e) A temporal series of in situ studies revealing expression of one gene in this class, Notch, at 0.5 h (b), 3 h (c), 12 h (d) and 24 h (e), showing how mRNA levels in the leading-edge keratinocytes appear to dip during the period of re-epithelialization and then increase again coincident with the time at which epidermal fronts contact one another. Arrows highlight region of gene expression. Scale bar = 100 μm.
Figure 6
Figure 6
Heatmaps for inflammation-dependent genes. (a-c) Heatmaps of the temporal profiles of mRNA intensity during the 24 h repair period for inflammation-dependent genes in wild-type and PU.1 null wounds. (a) The early inflammatory cluster corresponds to the earliest onset of the inflammatory response with a temporally later induction seen in the late inflammatory cluster (b). (c) The inflammation-maintained cluster also appears to be regulated by the inflammatory response. Highest levels of expression are indicated by progressively brighter shades of red and lower expression levels represented by progressively brighter shades of green, as shown by the scale bar. Genes are ordered, for each cluster, with the most highly expressed first, and gene names are shown to the right of the maps.
Figure 7
Figure 7
Temporal and spatial expression profiles of sample genes from the three inflammation-dependent clusters. Temporal and spatial profiles of the (A) early inflammatory, (B) late inflammatory and (C) inflammation-maintained clusters. Line graphs display absolute temporal expression levels (y-axis) at each time point (x-axis) for both PU.1 null (pink) and wild-type (blue) wounds. y-axis expression levels vary according to individual gene expression levels. In situ hybridization studies of (A) 12 h, (B) 24 h or (C) 3 h frozen sections illustrate the contrasting expression patterns of each of these classes of genes in wild-type (WT) versus PU.1 null wounds. (Aa,d,g,j,m,p,s) In the early inflammatory cluster, expression in wild-type wounds peaks at 12 h but is absent or significantly reduced in PU.1 null wounds. (Ab,c) In situ studies show L-plastin to be expressed by activated leukocytes in the wild-type only (arrow). (Ae,f) Faint expression of C3 is seen in both genotypes (see arrows). (Ah,i) Onzin expression appears to be in the same cells within the connective tissue in both genotypes. (Ak,l) Both keratinocytes and leukocytes (arrows) express MRP14 in the wild-type but only keratinocyte expression (arrow) is seen in the PU.1 null wound. (An,o) Osteopontin displays a possible 'fibrosis' gene spatial profile with expression in deep dermal cell layers (arrow) in the wild-type only. (Aq,r) CCr1 is expressed only in the wild-type wound, in cells whose clustered location suggests they are one of the leukocyte lineages.(At,u) Expression of CXC10 is broad and throughout the wound connective tissue of wild-type wounds (arrow) suggesting that expressing cells are wound fibroblasts. (B) In the late inflammatory cluster, expression in wild-type wounds appears to peak beyond 12 h in wild-type wounds and is absent or reduced in PU.1 null wounds. (Bb,c) Expression of Cathepsin S is seen in activated leukocytes in the wild-type only (arrow). (Bd) Repetin is expressed by both genotypes but to a lower level in the PU.1 null. (Be,f) Repetin is only upregulated by keratinocytes but is not restricted only to wild-type wounds (arrows). (Bh,i) Expression of the potential fibrosis gene Angiotensin II Receptor 1 is seen in deep dermal cell layers of wild-type and, to a significantly reduced level, PU.1 null wounds (arrows). (C) In the inflammation maintained cluster, the expression profiles suggest that while these genes may be initially expressed in PU.1 null wounds, persistent expression requires the presence of an inflammatory response as in the wild-type wound situation. (Cb,c) Expression of Mcpt5 is seen at both wound sites (arrows) in scattered cells throughout the wound connective tissue. (Ce,f) CCL2 appears to be expressed by host wound cells at both wound sites (see arrows). (Ch,i) CCL7 is expressed in an almost identical temporal and spatial profile to CCL2. Scale bars = 400 μm (Aa-o, Ba-f, C) and 250 μm (Ap-u and Bh,i).

References

    1. Martin P. Wound healing - aiming for perfect skin regeneration. Science. 1997;276:75–81. doi: 10.1126/science.276.5309.75. - DOI - PubMed
    1. Werner S, Grose R. Regulation of wound healing by growth factors and cytokines. Physiol Rev. 2003;83:835–870. - PubMed
    1. Iyer VR, Eisen MB, Ross DT, Schuler G, Moore T, Lee JCF, Trent JM, Staudt LM, Hudson J, Jr, Boguski MS, et al. The transcriptional program in the response of human fibroblasts to serum. Science. 1999;283:83–87. doi: 10.1126/science.283.5398.83. - DOI - PubMed
    1. Chang HY, Sneddon JB, Alizadeh AA, Sood R, West RB, Montgomery K, Chi JT, Rijn Mv M, Botstein D, Brown PO. Gene expression signature of fibroblast serum response predicts human cancer progression: similarities between tumors and wounds. PLoS Biol. 2004;2:E7. doi: 10.1371/journal.pbio.0020074. - DOI - PMC - PubMed
    1. McKercher SR, Torbett BE, Anderson KL, Henkel GW, Vestal DJ, Baribault H, Klemsz M, Feeney AJ, Wu GE, Paige CJ, Maki RA. Targeted disruption of the PU.1 gene results in multiple hematopoietic abnormalities. EMBO J. 1996;15:5647–5658. - PMC - PubMed

Publication types

MeSH terms

LinkOut - more resources