. 2005 Jan 18;102(3):690-4.
doi: 10.1073/pnas.0408315102. Epub 2005 Jan 10.

Carbon starvation in glacial trees recovered from the La Brea tar pits, southern California

Affiliations

Carbon starvation in glacial trees recovered from the La Brea tar pits, southern California

Joy K Ward et al. Proc Natl Acad Sci U S A. .

Abstract

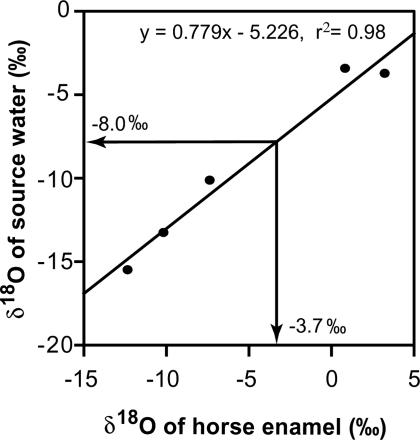
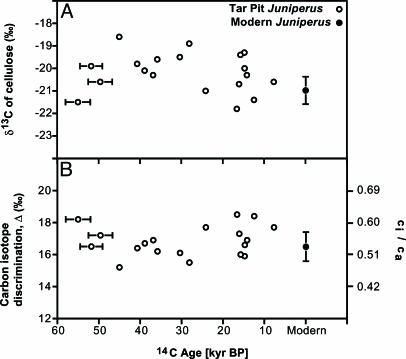
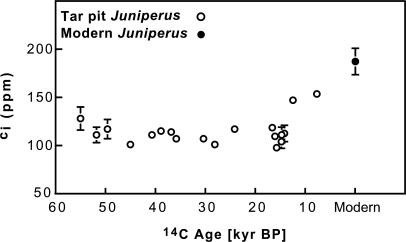
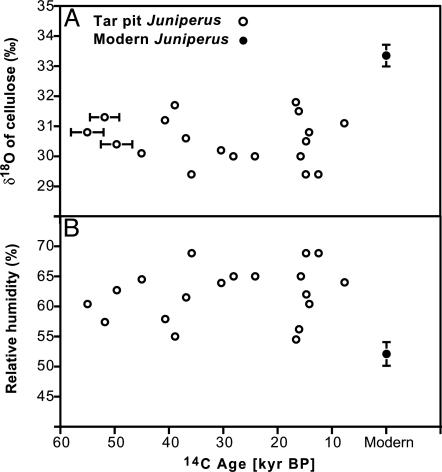
The Rancho La Brea tar pit fossil collection includes Juniperus (C3) wood specimens that 14C date between 7.7 and 55 thousand years (kyr) B.P., providing a constrained record of plant response for southern California during the last glacial period. Atmospheric CO2 concentration ([CO2]) ranged between 180 and 220 ppm during glacial periods, rose to approximately 280 ppm before the industrial period, and is currently approaching 380 ppm in the modern atmosphere. Here we report on delta13C of Juniperus wood cellulose, and show that glacial and modern trees were operating at similar leaf-intercellular [CO2](ci)/atmospheric [CO2](ca) values. As a result, glacial trees were operating at ci values much closer to the CO2-compensation point for C3 photosynthesis than modern trees, indicating that glacial trees were undergoing carbon starvation. In addition, we modeled relative humidity by using delta18O of cellulose from the same Juniperus specimens and found that glacial humidity was approximately 10% higher than that in modern times, indicating that differences in vapor-pressure deficits did not impose additional constrictions on ci/ca in the past. By scaling ancient ci values to plant growth by using modern relationships, we found evidence that C3 primary productivity was greatly diminished in southern California during the last glacial period.


Figures

Fig. 1.
Fig. 1.
The modern linear relationship between δ18O of source water and horse tooth enamel from a range of locations. This relationship was used to determine the δ18O of ancient source water at La Brea from horse tooth enamel recovered from the tar pits (see Materials and Methods for details) for purposes of modeling ancient relative humidity. Glacial values for δ18O of source water and horse tooth enamel at La Brea are indicated with arrows.
Fig. 2.
Fig. 2.
Representative wood images from tar pit Juniperus showing anatomical features that define the genus. (A) Tangential section showing axial parenchyma cells with nodular end walls (arrow). (B and C) Radial section showing ray parenchyma cells with nodular end walls (arrows) and indenture (circle). Note the cupressoid pit (arrowhead) that is characteristic of Juniperus. (Scale bars, 50 μm.)
Fig. 3.
Fig. 3.
δ13C of modern and tar pit Juniperus wood α-cellulose along with isotope discrimination and ci/ca values calculated from δ13C values. (A) Measurements of δ13C of α-cellulose (δ13Ccell) for glacial (tar pit) and modern Juniperus. x-axis errors indicate the 95% confidence interval for 14C age (contained within symbols for recent time). The modern symbol represents the average δ13Ccell of nine J. californica trees from Los Angeles (from natural areas), and the y-axis error indicates ± 1 SE. (B) Carbon isotope discrimination (Δ) and ci/ca values for glacial (tar pit) and modern trees that were determined from δ13Ccell values in A (see Eqs. 1 and 2 and text for details). Symbols and error bars are the same as in A.
Fig. 4.
Fig. 4.
ci of glacial (tar pit) and modern Juniperus. The ci ranges were calculated from known ci/ca values from carbon isotope measurements and by applying ca values from the Taylor Dome ice core (and the Vostok ice core in some cases). See Materials and Methods for a description of how ca values were determined from the conversion of radiocarbon ages to calendar ages. Glacial symbols represent the median of the ci range. The modern symbol represents the average ci of nine J. californica trees from Los Angeles (from natural areas), and the modern y-axis error indicates ±1 SE.
Fig. 5.
Fig. 5.
δ18O of modern and tar pit Juniperus wood α-cellulose and calculated relative humidity from 18O values. (A) δ18O of α-cellulose (δ18Ocell) for glacial (tar pit) and modern Juniperus. x-axis errors indicate the 95% confidence interval for 14C age. For modern Juniperus, the symbol represents the average δ18Ocell of eight J. californica trees from Los Angeles, and the y-axis error indicates ±1 SE. (B) Relative humidity estimates by using the Roden et al. (13) tree-ring cellulose model based on δ18Ocell from modern and glacial wood cellulose that is shown in A (see Materials and Methods for model parameters and validation).

References

    1. Euopean Project for Ice Coring in Antarctica (EPICA) community members (2004) Nature 429, 623-628.
    1. Berner, R. A. (2003) Nature 426, 323-326. - PubMed
    1. Sage, R. F. & Coleman, J. R. (2001) Trends Plant Sci. 6, 18-24. - PubMed
    1. Ward, J. K. (2004) in A History of Atmospheric CO2 and Its Effects on Plants, Animals, and Ecosystems, eds. Ehleringer, J. R., Cerling, T. & Dearing, D. (Springer, Berlin), in press.
    1. Polley, H. W., Johnson, H. B., Marino, B. D. & Mayeux, H. S. (1993) Nature 361, 61-64.

Publication types