Comparative Study
. 2005 Jan;12(1):60-7.
doi: 10.1128/CDLI.12.1.60-67.2005.

Acute inflammatory response to endotoxin in mice and humans

Affiliations
Comparative Study

Acute inflammatory response to endotoxin in mice and humans

Shannon Copeland et al. Clin Diagn Lab Immunol. 2005 Jan.

Abstract

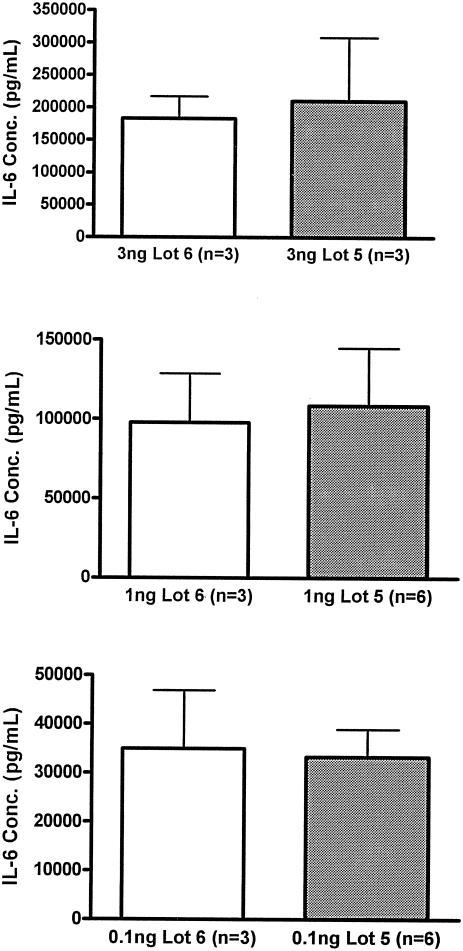
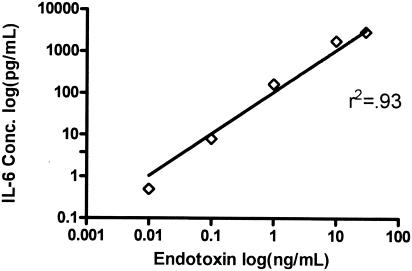
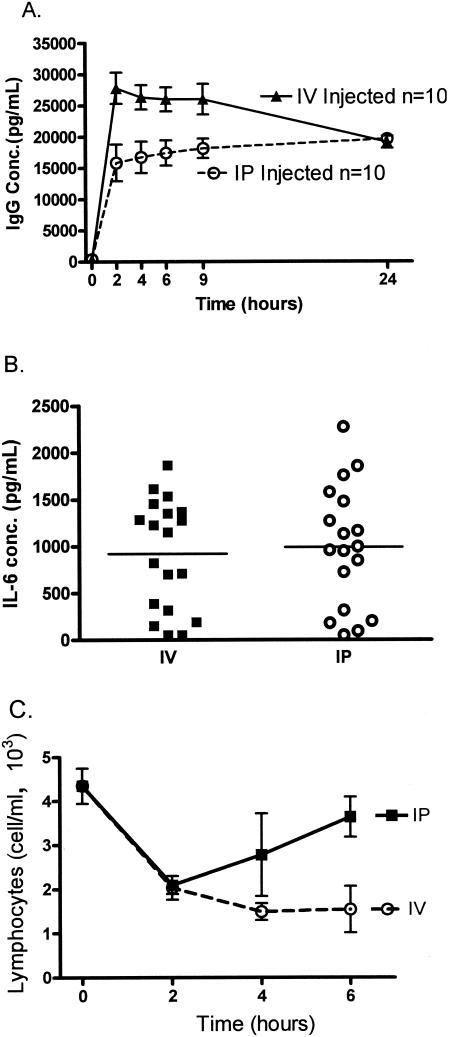
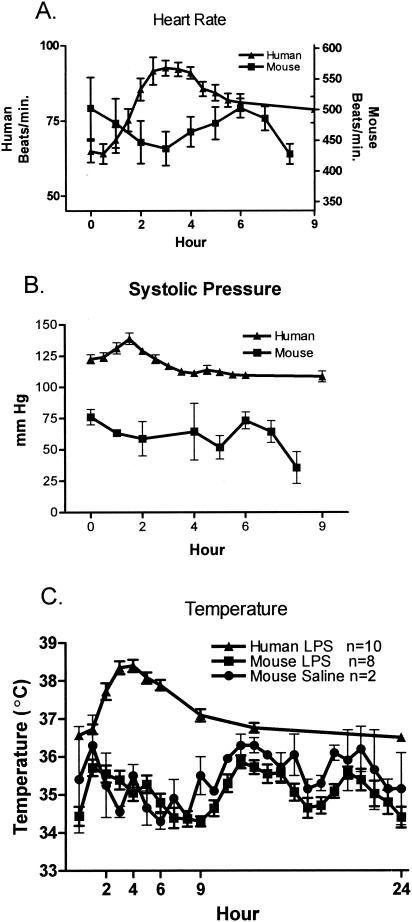
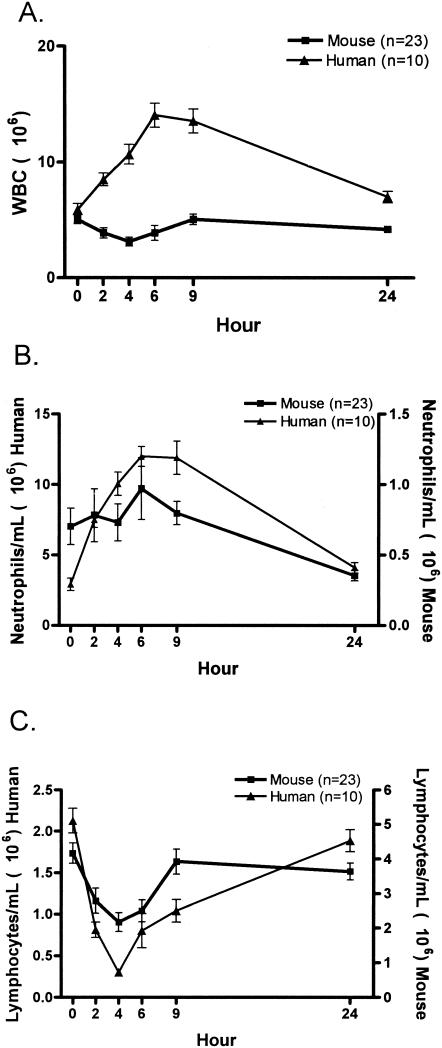
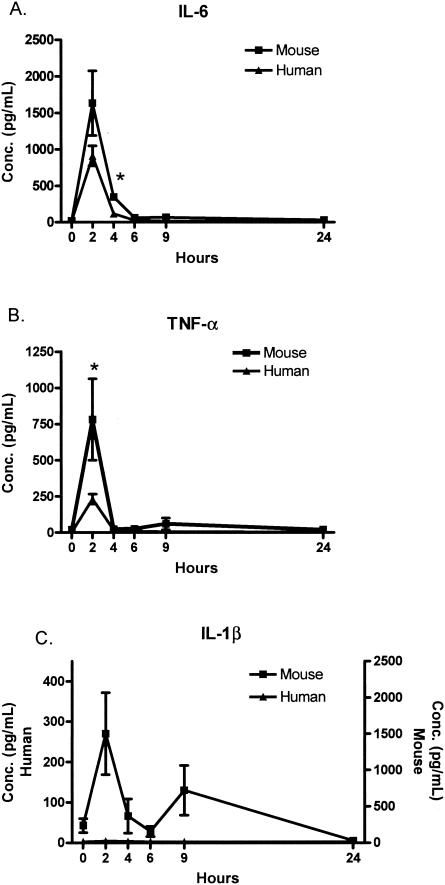
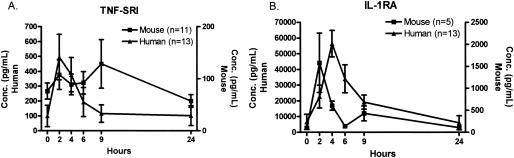
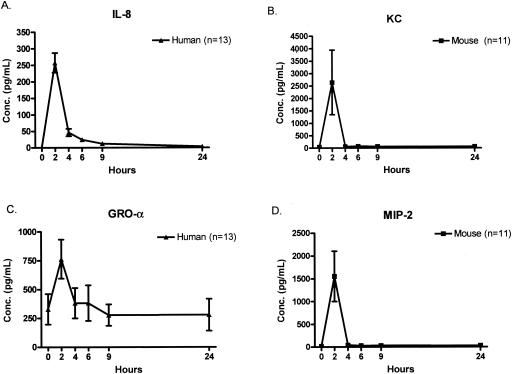
Endotoxin injection has been widely used to study the acute inflammatory response. In this study, we directly compared the inflammatory responses to endotoxin in mice and humans. Escherichia coli type O113 endotoxin was prepared under identical conditions, verified to be of equal biological potency, and used for both mice and humans. The dose of endotoxin needed to induce an interleukin-6 (IL-6) concentration in plasma of approximately 1,000 pg/ml 2 h after injection was 2 ng/kg of body weight in humans and 500 ng/kg in mice. Healthy adult volunteers were injected intravenously with endotoxin, and male C57BL/6 mice (n=4 to 12) were injected intraperitoneally with endotoxin. Physiological, hematological, and cytokine responses were determined. Endotoxin induced a rapid physiological response in humans (fever, tachycardia, and slight hypotension) but not in mice. Both mice and humans exhibited lymphopenia with a nadir at 4 h and recovery by 24 h. The levels of tumor necrosis factor (TNF) and IL-6 in plasma peaked at 2 h and returned to baseline levels by 4 to 6 h. IL-1 receptor antagonist RA and TNF soluble receptor I were upregulated in both mice and humans but were upregulated more strongly in humans. Mice produced greater levels of CXC chemokines, and both mice and humans exhibited peak production at 2 h. These studies demonstrate that although differences exist and a higher endotoxin challenge is necessary in mice, there are several similarities in the inflammatory response to endotoxin in mice and humans.


Figures

FIG. 1.
FIG. 1.
Ex vivo IL-6 production. Human whole blood was stimulated with the indicated doses of the E. coli O113 endotoxin that was used in the human studies (lot 6) or murine studies (lot 5). Plasma was harvested after 6 h of stimulation, and IL-6 concentrations (Conc.) were determined. At each dose of endotoxin, both lots induced statistically similar amounts of IL-6. Each value is the mean ± SEM (error bar) for the indicated number of donors.
FIG. 2.
FIG. 2.
IL-6 production with increasing doses of endotoxin. Mice were injected with the indicated doses of endotoxin, and plasma was harvested 2 h later. Increasing doses of endotoxin resulted in increasing plasma IL-6 levels. Note that both the IL-6 concentration (Conc.) and endotoxin dose are plotted on a log scale. The line indicates the regression through the data.
FIG. 3.
FIG. 3.
Effect of route of administration (i.v. versus i.p.). (A) Rabbit IgG was injected i.v. and i.p. to determine the distribution of a relatively inert, large molecule. Serial blood samples were drawn from the same mouse every 2, 6, 9, and 24 h. Each value is the mean ± SEM (error bar) for 10 mice. Conc., concentration. (B and C) Ten nanograms of endotoxin was diluted in normal saline and injected in a 100-μl volume either i.p. or i.v. Mice were sacrificed at 2, 4, or 6 h after injections. (B) IL-6 production from individual mice at 2 h. (C) Changes in lymphocyte counts over time. Each value is the mean ± SEM (error bar) for eight mice.
FIG. 4.
FIG. 4.
Physiological changes. (A) Heart rate increased in humans, while no changes were observed in the mice after endotoxin administration. (B) Systolic blood pressure also increased slightly with no real change in the mice. In panels A and B, each value is the mean ± SEM (error bar) for 10 humans or 6 to 10 mice. (C) Body temperature increased in response to endotoxin in humans but no discernible pattern was seen in the mice. Data from two mice injected with saline are included to demonstrate that the changes in body temperature are not due to the endotoxin but to normal diurnal variations.
FIG. 5.
FIG. 5.
Hematological alterations after endotoxin injection. (A) Humans have an overall increase in circulating WBCs, while the murine response is virtually unchanged. Neutrophilia (B) and lymphopenia (C) develop in mice and humans. In panels B and C, the human and mouse data are plotted on different scales, since the number of circulating cells differs in mice and humans. Each value is the mean ± SEM (error bar) for 10 humans or 23 mice.
FIG. 6.
FIG. 6.
Rapid induction of proinflammatory cytokines after endotoxin injection. Both IL-6 and TNF quickly appeared in the plasma and returned to baseline levels (not detected) by 6 h. IL-1β was not detected in the human samples at any time point. Note the different axes in panel C. Each value is the mean ± SEM (error bar) for 4 to 13 humans or 5 to 11 mice. Values that were significantly different (P < 0.05) in mice and humans are indicated by an asterisk. Conc., concentration.
FIG. 7.
FIG. 7.
Profiles of anti-inflammatory cytokines after endotoxin injection. Similar kinetics of appearance of TNF-SRI and IL-1RA were observed in mice and humans, although the levels of the anti-inflammatory cytokines were substantially greater in humans than in mice. Each value is the mean ± SEM (error bar) for 13 humans or 5 to 11 mice. Conc., concentration.
FIG. 8.
FIG. 8.
Kinetics of CXC chemokine appearance after endotoxin injection. Each of the measured CXC chemokines peaked within 2 h of endotoxin injection. Note that the values of KC and macrophage inflammatory protein 2 in the mouse were significantly higher than IL-8 or growth-related oncogene-α in humans. Each value is the mean ± SEM (error bar) for 13 humans or 11 mice. Conc., concentration.

References

    1. Barber, A. E., S. M. Coyle, M. A. Marano, E. Fischer, S. E. Calvano, Y. Fong, L. L. Moldawer, and S. F. Lowry. 1993. Glucocorticoid therapy alters hormonal and cytokine responses to endotoxin in man. J. Immunol. 150:1999-2006. - PubMed
    1. Boujoukos, A. J., G. D. Martich, E. Supinski, and A. F. Suffredini. 1993. Compartmentalization of the acute cytokine response in humans after intravenous endotoxin administration. J. Appl. Physiol. 74:3027-3033. - PubMed
    1. Caldwell, F. T., Jr., D. B. Graves, and B. H. Wallace. 1999. Humoral versus neural pathways for fever production in rats after administration of lipopolysaccharide. J. Trauma 47:120-129. - PubMed
    1. Calvano, S. E., W. A. Thompson, M. N. Marra, S. M. Coyle, H. F. de Riesthal, R. K. Trousdale, P. S. Barie, R. W. Scott, L. L. Moldawer, and S. F. Lowry. 1994. Changes in polymorphonuclear leukocyte surface and plasma bactericidal/permeability-increasing protein and plasma lipopolysaccharide binding protein during endotoxemia or sepsis. Arch. Surg. 129:220-226. - PubMed
    1. Cannon, J. G., R. G. Tompkins, J. A. Gelfand, H. R. Michie, G. G. Stanford, J. W. van der Meer, S. Endres, G. Lonnemann, J. Corsetti, B. Chernow, et al. 1990. Circulating interleukin-1 and tumor necrosis factor in septic shock and experimental endotoxin fever. J. Infect. Dis. 161:79-84. - PubMed

Publication types

LinkOut - more resources