Comparative Study
. 2005 Jan;144(1):59-70.
doi: 10.1038/sj.bjp.0706020.

Contrasting anesthetic sensitivities of T-type Ca2+ channels of reticular thalamic neurons and recombinant Ca(v)3.3 channels

Affiliations
Comparative Study

Contrasting anesthetic sensitivities of T-type Ca2+ channels of reticular thalamic neurons and recombinant Ca(v)3.3 channels

Pavle M Joksovic et al. Br J Pharmacol. 2005 Jan.

Abstract

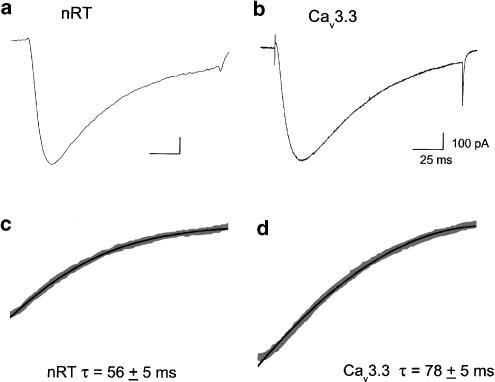
Reticular thalamocortical neurons express a slowly inactivating T-type Ca(2+) current that is quite similar to that recorded from recombinant Ca(v)3.3b (alpha1Ib) channels. These neurons also express abundant Ca(v)3.3 mRNA, suggesting that it underlies the native current. Here, we test this hypothesis by comparing the anesthetic sensitivities of recombinant Ca(v)3.3b channels stably expressed in HEK 293 cells to native T channels in reticular thalamic neurons (nRT) from brain slices of young rats. Barbiturates completely blocked both Ca(v)3.3 and nRT currents, with pentobarbital being about twice more potent in blocking Ca(v)3.3 currents. Isoflurane had about the same potency in blocking Ca(v)3.3 and nRT currents, but enflurane, etomidate, propofol, and ethanol exhibited 2-4 fold higher potency in blocking nRT vs Ca(v)3.3 currents. Nitrous oxide (N(2)O; laughing gas) blocked completely nRT currents with IC(50) of 20%, but did not significantly affect Ca(v)3.3 currents at four-fold higher concentrations. In addition, we observed that in lower concentration, N(2)O reversibly increased nRT but not Ca(v)3.3 currents. In conclusion, contrasting anesthetic sensitivities of Ca(v)3.3 and nRT T-type Ca(2+) channels strongly suggest that different molecular structures of Ca(2+) channels give rise to slowly inactivating T-type Ca(2+) currents. Furthermore, effects of volatile anesthetics and ethanol on slowly inactivating T-type Ca(2+) channel variants may contribute to the clinical effects of these agents.


Figures

Figure 1
Figure 1
Both recombinant Cav3.3 and native nRT T currents have slow inactivation kinetics. (a) Traces evoked from Vh −100 mV and Vt −50 mV from 13 nRT cells are averaged. (b) Similar currents averaged from 11 HEK cells transfected with Cav3.3 constructs are evoked from Vh −90 mV to Vt −30 mV. Bars indicate calibration. (c) A single exponential fit (dark line) of inactivating portion of the nRT current from panel (a) gave an average inactivation τ of 56±5 ms. (d) A single exponential fit (dark line) of inactivating portion of the Cav3.3 current from panel (b) gave an average inactivation τ of 78±5 ms.
Figure 2
Figure 2
Barbiturates block Cav3.3 currents. (a) T currents are reversibly blocked by three different concentrations of thiopental. Inactivation τ changed from 80 ms in control to 62 ms in the presence of 0.3 mM thiopental. (b) Time course of an experiment showing the block of peak currents by thiopental (same cells as in panel (a). Peak inward current is plotted as function of time and horizontal solid bars indicate times of application. Note fast onset and offset, as well as near complete recovery from thiopental blocking action. (c) Representative traces from cells where 1 mM of thiopental, pentobarbital, and phenobarbital are used. Note that this concentration of thiopental and pentobarbital blocked almost completely, while phenobarbital blocked only 42% of peak inward current. (d) Concentration–response curves for three barbiturates are shown, with each point being the average of 6–9 different cells. Symbols indicate different anesthetic as indicated on this figure. Vertical lines are s.e. the solid lines are best fits with the Hill equation where the steepness of the slope is described by the coefficient h. IC50 values for block of Cav3.3 current were 180±42 μM (h=1.0±0.2, n=17) for pentobarbital, 260±52 μM (h=1.64±0.5, n=9) for thiopental, and 1000±200 μM (h=1.0±0.2, n=12) for phenobarbital.
Figure 3
Figure 3
Effects of propofol and etomidate on Cav3.3 currents. (a) Experiments from an HEK cell show effects of three different concentrations of propofol on Cav3.3 currents. Propofol increased the apparent inactivation of current by decreasing inactivation τ (from 65 ms in control saline, to 27 ms with application of 30 μM propofol). Note that propofol blocked current nearly completely when higher concentrations are used. (b) This panel depicts representative traces showing reversible block of Cav3.3 currents with 0.1 and 0.3 mM etomidate. Similar to propofol, etomidate increased inactivation of the current by decreasing inactivation τ by about 50% (from 78 ms in control saline to 40 ms with anesthetic application). (c) The time course of block by randomly applied multiple concentrations of propofol is plotted for the same cell as in (a). Bars indicate time of application. (d) Time course of etomidate-induced Cav3.3 current blockade is depicted (same cell shown in panel b). Horizontal bars indicate time of application of 0.1 and 0.3 mM etomidate. (e) The concentration dependence for block of Cav3.3 currents by propofol (open circles, n=13 cells, IC50 60 ±12 μM, h=1.5±0.4). (f) Concentration–response curve for etomidate block of Cav3.3 currents from total of 13 cells. Each symbol represents the average from at least five different cells. The solid line represents the fit to the average data: IC50 of 90±14 μM and h=1.54±0.34.
Figure 4
Figure 4
Pentobarbital, etomidate, and propofol block slow thalamic T currents. (a–e). Time course of block of peak T current in different nRT cells in slices perfused with different concentrations of pentobarbital, etomidate, and propofol. Bars indicate time of application. Insets depicts traces of T current evoked by depolarizing to −50 from −100 mV for the given experiments where time course of block is presented. An asterisk (*) marks currents obtained while drugs were applied. Two control traces indicate currents before and after drug application. Calibration for T current in top left panel applies for all T currents. (f) Average concentration–response curves for propofol (open squares, n=17 cells), etomidate (filled triangles, n=18 cells), and pentobarbital (filled circles, n=19 cells). Solid lines indicate best fit for average data giving IC50 of 25±2, 25±4 and 264±76 μM for etomidate, propofol, and pentobarbital, respectively. Slope of the curve indicating steepness of concentration–response relationship was 1.7±0.5, 1.6±0.7, and 1.3±0.2 for propofol, pentobarbital, and etomidate, respectively.
Figure 5
Figure 5
Ethanol blocks Cav3.3 and nRT T currents. (a) Traces show nRT currents activated at −50 mV in the presence and absence of 2 concentrations of ethanol. (b) Time course from the same experiment showing reversibility of ethanol's effects on nRT currents. (c) Traces showing very little block of Cav3.3 currents by 100 and 200 mM ethanol. Bars indicate the calibration. (d) Percent block of peak nRT current is plotted as a function of time. Bars indicate the time of application. Note that 200 mM ethanol blocked only about 37% of Cav3.3 current while almost completely blocked nRT current (panel b). (e) Comparison of sensitivity to ethanol of Cav3.3 (open circles) and nRT currents (solid squares). All symbols are averaged from multiple determinations (n=9 cells for Cav3.3 and n=25 cells for nRT). Solid lines represent fit to the average data: Cav3.3, IC50 of 365±32 mM, h=2.2±0.4; and for nRT, IC50 of 100±1 mM and h=2.4±0.1.
Figure 6
Figure 6
Isoflurane and enflurane block Cav3.3 currents in subanesthetic concentrations. (a) Traces show Cav3.3 currents activated at −30 mV in the presence and absence of isoflurane. Similar to propofol and etomidate, isoflurane increased the apparent inactivation rate (inactivation τ was 87 ms in control conditions, and 32 ms after isoflurane was applied). (b) Traces from another experiment where isoflurane's isomer, enflurane was applied. Enflurane (520 μM) blocked 75% of the peak current and decreased the inactivation τ about three-fold (from 72 to 23 ms). (c) Time course of the effects of four different concentrations of isoflurane on peak Cav3.3 current is plotted. Horizontal bars indicate times of application. Note fast onset and offset of isoflurane's effects on the peak inward current. (d) Percent block of peak Cav3.3 current is plotted as a function of isoflurane (open circles) and enflurane (solid circles) concentrations (n=8 cells for enflurane and n=9 cells for isoflurane). Solid lines represent fit to the average data: isoflurane, IC50 of 260±23 μM, h=1.7±0.3; and for enflurane, IC50 of 360±21 μM and h=1.7±0.2. (e) Traces show minimal effect (about 7% block) of 80% N2O on peak Cav3.3 current. In contrast, 600 μM isoflurane blocked about 70% of the peak current. (f) Time course of the experiment depicted on panel (e) of this figure is presented. Horizontal bars indicate times of application of 80% N2O and 600 μM isoflurane.
Figure 7
Figure 7
Effects of N2O on T currents in nRT cells. (a) Representative traces showing effects 8% N2O on an nRT cell. (b) Time course from the same experiments depicted on panel (a) indicate reversible increase of about 50% of peak current. (c) At concentrations of 80% N2O almost completely blocked nRT current as indicated on this cell. (d) Time course from the same experiment depicted on panel (c) indicate fast onset and offset of block by N2O. (e) Filled circles indicate average block of nRT currents by 20, 40, and 80% N2O (n=25 cells). Solid line is best fit of the data giving IC50 of 20.0±0.1%, fitted maximal block of 85±1% and h of 2.4±0.1. Open symbol indicates average block of Cav3.3 currents by 80% N2O.

References

    1. BARASH P.G., CULLEN B.F., STOELTING R.K.Neurophysiology and neuroanesthesia Clinical Anesthesia 1992Philadelphia: J.B. Lippincott; 871–918.2nd edn. ed. BENDO, A.A. pp
    1. BOSNJAK Z.J., SUPAN F.D., RUSCH N.J. The effects of halothane, enflurane, and isoflurane on calcium current in isolated canine ventricular cells. Anesthesiology. 1991;74:340–345. - PubMed
    1. CATLIN M.C., GUIZZETTI M., COSTA L.G. Effects of ethanol on calcium homeostasis in the nervous system: implications for astrocytes. Mol. Neurobiol. 1999;19:1–24. - PubMed
    1. CHEMIN J., MONTEIL A., PEREZ-REYES E., BOURINET E., NARGEOT J., LORY P. Specific contribution of human T-type calcium channel isotypes (α1G, α1H and α1I) to neuronal excitability. J. Physiol. 2002;540:3–14. - PMC - PubMed
    1. CRIBBS L.L., LEE J.H., YANG J., SATIN J., ZHANG Y., DAUD A., BARCLAY J., WILLIAMSON M.P., FOX M., REES M., PEREZ-REYES E. Cloning and characterization of α1H from human heart, a member of the T-type Ca2+ channel gene family. Circ. Res. 1998;83:103–109. - PubMed

Publication types

MeSH terms