. 2005 Jan 18;102(3):667-72.
doi: 10.1073/pnas.0409143102. Epub 2005 Jan 12.

Quantitative phosphorylation profiling of the ERK/p90 ribosomal S6 kinase-signaling cassette and its targets, the tuberous sclerosis tumor suppressors

Affiliations

Quantitative phosphorylation profiling of the ERK/p90 ribosomal S6 kinase-signaling cassette and its targets, the tuberous sclerosis tumor suppressors

Bryan A Ballif et al. Proc Natl Acad Sci U S A. .

Abstract

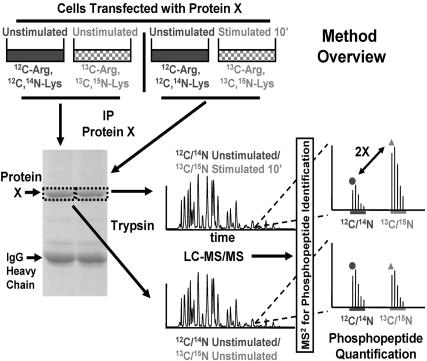
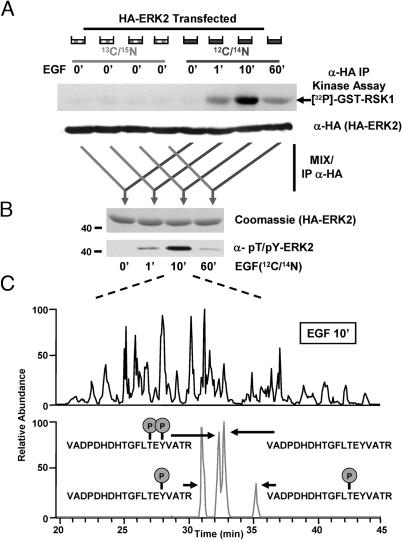
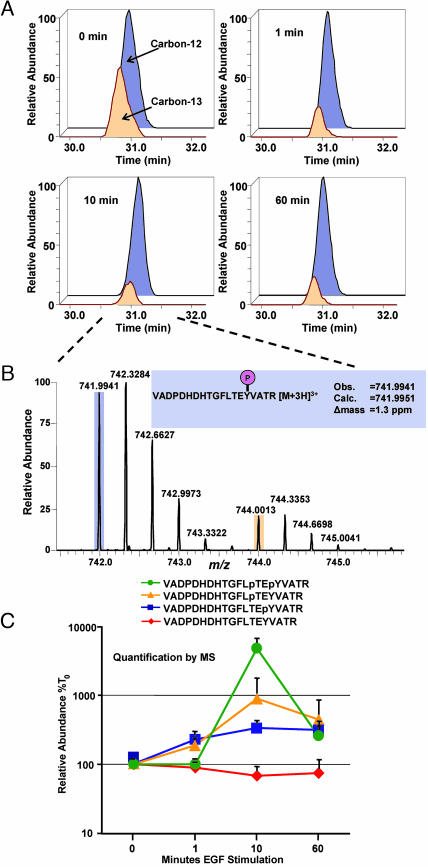
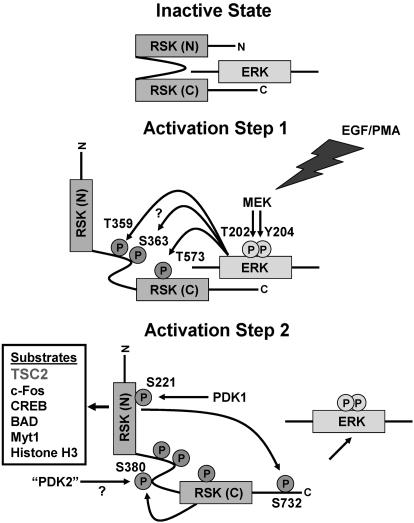
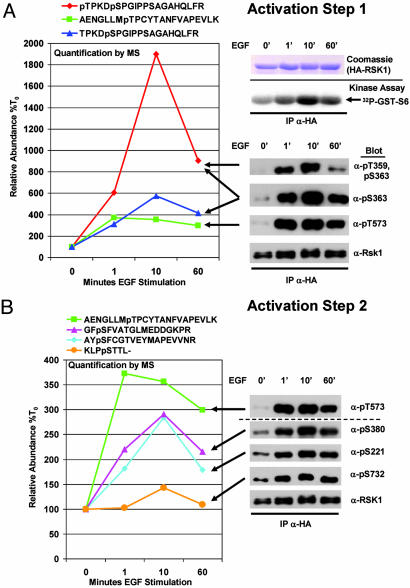
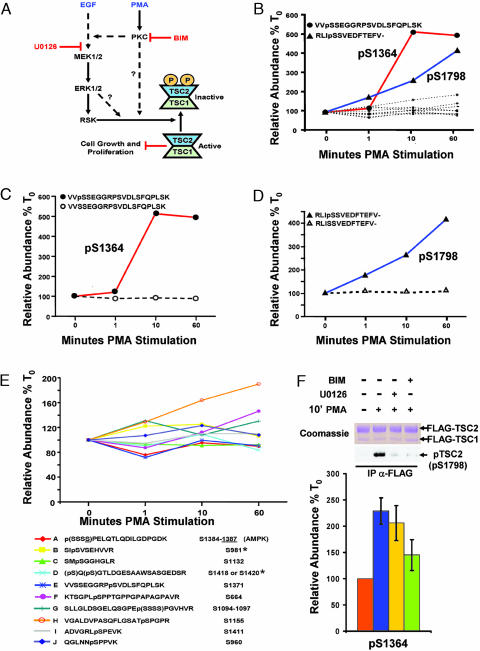
Reversible protein phosphorylation is an essential cellular regulatory mechanism. Many proteins integrate and are modulated by multiple phosphorylation events derived from complex signaling cues. Simultaneous detection and quantification of temporal changes in all of a protein's phosphorylation sites could provide not only an immediate assessment of a known biochemical activity but also important insights into molecular signaling mechanisms. Here we show the use of stable isotope-based quantitative MS to globally monitor the kinetics of complex, ordered phosphorylation events on protein players in the canonical mitogen-activated protein kinase signaling pathway. In excellent agreement with activity assays and phosphospecific immunoblotting with the same samples, we quantified epidermal growth factor-induced changes in nine phosphorylation sites in the extracellular signal-regulated kinase (ERK)/p90 ribosomal S6 kinase-signaling cassette. Additionally, we monitored 14 previously uncharacterized and six known phosphorylation events after phorbol ester stimulation in the ERK/p90 ribosomal S6 kinase-signaling targets, the tuberous sclerosis complex (TSC) tumor suppressors TSC1 and TSC2. By using quantitative phosphorylation profiling in conjunction with pharmacological kinase inhibitors we uncovered a ERK-independent, protein kinase C-dependent pathway to TSC2 phosphorylation. These results establish quantitative phosphorylation profiling as a means to simultaneously identify, quantify, and delineate the kinetic changes of ordered phosphorylation events on a given protein and defines parameters for the rapid discovery of important in vivo phosphoregulatory mechanisms.


Figures

Fig. 1.
Fig. 1.
Method overview. Equal amounts of cells are grown in normal media or stable-isotope labeling media containing [13C6]Arg and [13C6, 15N2]Lys. All cells are then transfected with a given “protein X” under study. Sets of unlabeled and labeled cells are grouped, and acute stimulation with a biological factor is performed for different times (here, 0 and 10 min) on the labeled (here, on the labeled cells for 10 min) or unlabeled cells, exclusively. Cells are then lysed, and equal quantities of lysate from unstimulated and stimulated cells are mixed. Protein X is immunoprecipitated (IP) and subjected to SDS/PAGE. The band for protein X is excised and digested with trypsin. The resultant mixture of labeled and unlabeled peptides from each stimulation time point is subjected to LC-MS/MS. Full MS scans are detected in the Fourier transform-ion cyclotron resonance cell, and MS/MS analysis is performed in the linear ion trap. The data from the MS/MS scans are searched by using sequest against the sequence for protein X to identify (phosphorylated and nonphosphorylated) peptides. A return to the MS scans containing the identified peptide reveals its respective isotopic envelope as well as the envelope of its labeled counterpart, separated by an appropriate m/z. The ratio of labeled to unlabeled peptide (measured here by using the area under the unlabeled and labeled monoisotopic peaks) at time 0 is compared with the same ratio for the peptide at any given point in time after stimulation. This example depicts a 2-fold increase in the relative phosphopeptide abundance.
Fig. 2.
Fig. 2.
Phosphorylation profiling of ERK2 after EGF stimulation. (A) Unlabeled cells or cells metabolically labeled with [13C6, 15N2]Lys and [13C6]Arg were transfected with an expression construct for HA-ERK2. Cells were then stimulated with EGF for the indicated time points. Cells were lysed, and a portion of each extract was subjected to either anti-HA immune complex kinase reactions (Upper) or anti-HA immunoblotting (Lower). (B) Equivalent amounts of unstimulated, labeled extract were mixed with stimulated unlabeled extract, and HA-ERK2 was immunoprecipitated. Portions of the immune complexes were subjected to SDS/PAGE and visualization by either Coomassie blue-staining (Upper) or immunoblotting by using phosphospecific antibodies to dually phosphorylated, activated ERK2 (Lower). (C) (Upper) Base peak chromatogram of a tryptic digest of the HA-ERK2 mixed sample (shown in B) containing peptides from the unstimulated, labeled state and the 10′ EGF-stimulated, unlabeled state. (Lower) The same chromatogram reduced to show only mass ranges of the unphosphorylated and phosphorylated peptides (± 5 ppm) derived from the activation loop of ERK2. Specific assignments for each peak were determined by using accurate mass measurements and the elution times at which MS/MS sequencing data were obtained for each peptide.
Fig. 3.
Fig. 3.
Relative abundance of labeled to unlabeled phosphopeptides enables their quantitative and temporal profiling. (A) Measured areas of the unlabeled (741.9941 ± 5 ppm) and labeled (744.0013 ± 5 ppm) monoisotopic peaks for the monophosphorylated, phosphotyrosyl-peptide in the ERK2 activation loop are presented for each time point after EGF stimulation as indicated. (B) The measured isotopic envelopes for the same phosphopeptide are shown after 10 min of EGF stimulation. Note the separation in m/z space of the unlabeled and labeled peptides. (C) After a repetition of the experiment with EGF stimulation occurring on the labeled samples, the relative abundance ratios at each time point for each peptide were calculated. Error bars denote the standard deviation of the mean.
Fig. 4.
Fig. 4.
Ordered phosphorylation events occur in two main activation steps to fully activate RSK1. In its inactive state, RSK1 is in a complex with inactive ERK1 or ERK2. In activation step one, a variety of extracellular stimuli activate ERK1 and ERK2. Active ERK1 and ERK2 phosphorylate Thr-573 in the activation loop of the carboxyl-terminal kinase domain of RSK1, which leads to the phosphorylation of two sites in its linker region by ERKs or other kinases. Phosphorylation in the linker region is thought to unfold the kinase, priming it for the final activation step. In activation step two, the carboxyl-terminal kinase domain (and/or a putative 3-phosphoinositide-dependent kinase, “PDK2”) phosphorylates Ser-380 and thereby increases the docking of 3-phosphoinositide-dependent kinase-1 (PDK1), which phosphorylates Ser-221 in the activation loop of the amino-terminal kinase domain of RSK1. The final event is autophosphorylation of the carboxyl-terminus by the amino-terminal kinase domain. This event releases ERK, and fully active RSK1 finds a growing number of known substrates located throughout the cell. MEK, mitogen-activated protein kinase kinase; CREB, cAMP response element binding protein.
Fig. 5.
Fig. 5.
Phosphorylation profiling of RSK1 after EGF stimulation. HA-tagged RSK1 was expressed in labeled and unlabeled cells, and EGF stimulations for the indicated times were performed as was done for ERK2 as indicated. (A) (Right Upper) Anti-HA immune complexes of mixed labeled and unlabeled RSK1 were subjected to SDS/PAGE and visualized by staining with Coomassie blue. (Right Lower) Anti-HA immune complex kinase assays of stimulated extracts show peak RSK1 activity at 10 min after EGF stimulation. (Left) Phosphopeptide quantifications are depicted in the graph, and arrows indicate their relationship to corresponding phosphospecific antibody blots for the indicated sites occurring in activation step 1. (B) Phosphorylation profiling of activation step 2 was performed as for step 1. Duplication of the data for pThr-573 is provided to emphasize the kinetic differences between activation steps 1 and 2.
Fig. 6.
Fig. 6.
Phosphorylation profiling of TSC2 after PMA stimulation. (A) Signaling diagram indicating PKC- and mitogen-activated protein kinase-dependent phosphoregulation of TSC1 and TSC2. Also indicated are the positions in the pathways where indicated pharmacological inhibitors are exerting their effects. (B) Quantification of changes in 12 TSC2 phosphopeptides over the time course of PMA stimulation from one run for each time point. Emphasis is placed on the two phosphopeptides (containing pSer-1364 and pSer-1798, respectively) showing a marked increase after PMA stimulation. (C-D) These phosphopeptides are graphed relative to the corresponding changes in their unphosphorylated counterparts. (E) Further examination of the TSC2 phosphopeptides from B that did not show large changes after PMA stimulation. When the MS/MS spectrum could not distinguish the precise site of phosphorylation, the possible sites allowed by the data were placed in parentheses. AMP-activated protein kinase has been shown to phosphorylate Ser-1387 in vivo, all other sites have not previously been reported, except for those marked with an asterisk, which have been shown to be phosphorylated by Akt in vitro. Human numbering is used for reference. (F) Pharmacological inhibitors define a previously uncharacterized PKC-dependent pathway to TSC2. Labeled and unlabeled cells transfected with FLAG-TSC1 and FLAG-TSC2 were starved and either left unstimulated or stimulated with PMA for 10 min with or without pretreatment for 30 min with the indicated inhibitors. Mixed extracts were immunoprecipitated with anti-FLAG antibodies and subjected to SDS/PAGE and either Coomassie staining for phosphorylation profiling or immunoblotting for TSC2 pSer-1798 with a phosphospecific motif antibody (as defined in ref. 14). Quantification of the tryptic peptide harboring pSer-1798 is shown as the average of three experiments; in two of the experiments, the stimulation was performed on the labeled cells, and, for the other experiment, the stimulation was performed on the unlabeled cells. Error bars denote the standard error of the mean. For the comparison between PMA stimulation with no drug and PMA stimulation with BIM, P = 0.05 for a one-tailed Student's t test.

References

    1. Gerber, S. A., Rush, J., Stemman, O., Kirschner, M. W. & Gygi, S. P. (2003) Proc. Natl. Acad. Sci. USA 100, 6940-6945. - PMC - PubMed
    1. Ong, S. E., Blagoev, B., Kratchmarova, I., Kristensen, D. B., Steen, H., Pandey, A. & Mann, M. (2002) Mol. Cell Proteomics 1, 376-386. - PubMed
    1. Chen, X., Smith, L. M. & Bradbury, E. M. (2000) Anal. Chem. 72, 1134-1143. - PubMed
    1. Blagoev, B., Ong, S. E., Kratchmarova, I. & Mann, M. (2004) Nat. Biotechnol. 22, 1139-1145. - PubMed
    1. Ibarrola, N., Kalume, D. E., Gronborg, M., Iwahori, A. & Pandey, A. (2003) Anal. Chem. 75, 6043-6049. - PubMed

Publication types

MeSH terms

LinkOut - more resources