

doi: 10.1136/ard.2004.031815.
The EULAR-OMERACT rheumatoid arthritis MRI reference image atlas: the metacarpophalangeal joints
Affiliations
- PMID: 15647417
- PMCID: PMC1766829
- DOI: 10.1136/ard.2004.031815
Item in Clipboard
The EULAR-OMERACT rheumatoid arthritis MRI reference image atlas: the metacarpophalangeal joints
Ann Rheum Dis.
2005 Feb.
Abstract
This paper presents the metacarpophalangeal (MCP) joint magnetic resonance images of the EULAR-OMERACT rheumatoid arthritis MRI reference image atlas. The illustrations include synovitis in the MCP joints (OMERACT RA magnetic resonance imaging scoring system (RAMRIS), grades 0-3), bone oedema in the metacarpal head and the phalangeal base (grades 0-3), and bone erosion in the metacarpal head and the phalangeal base (grades 0-3, and examples of higher grades). The presented reference images can be used to guide scoring of MCP joints according to the OMERACT RA MRI scoring system.
Figures
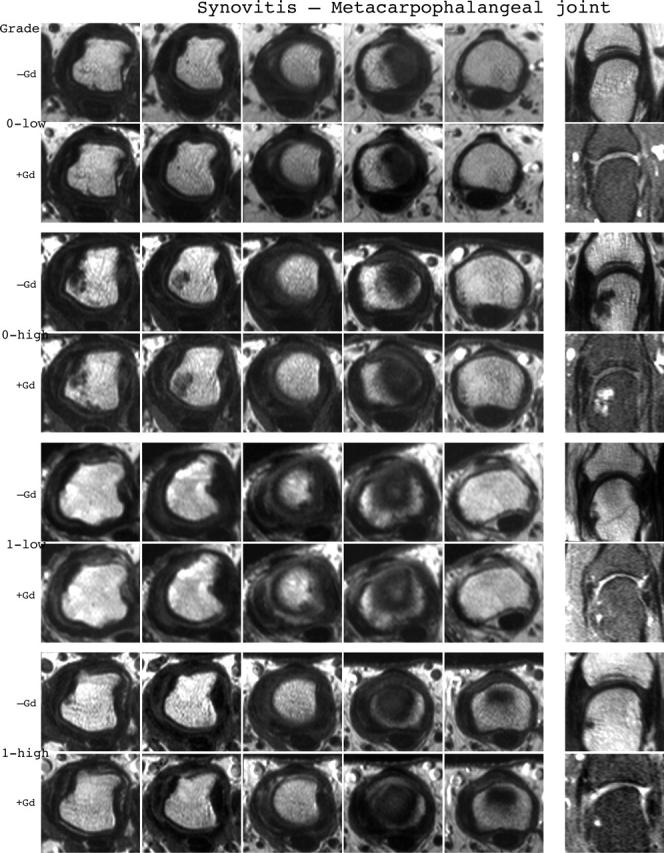
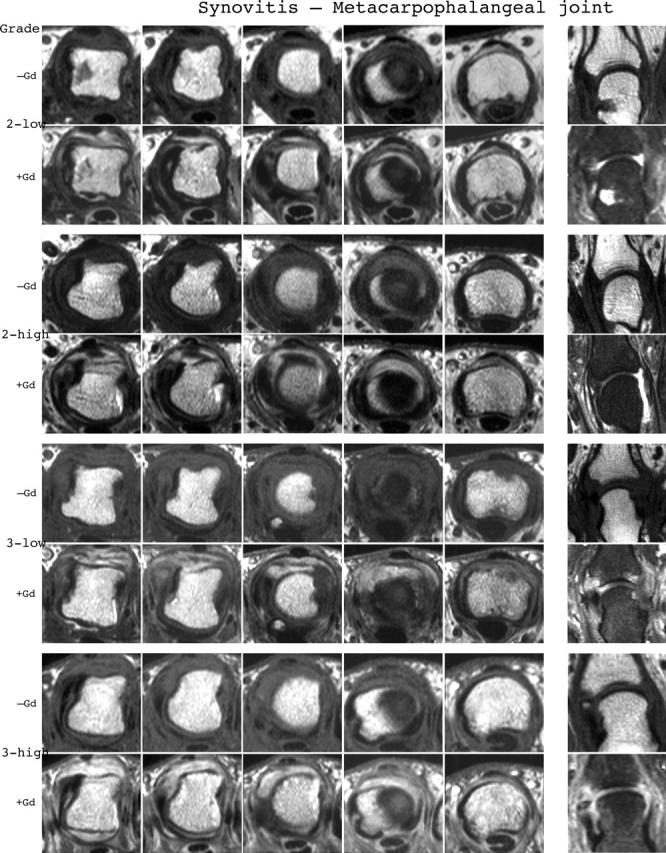
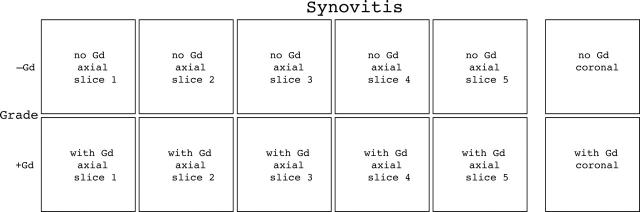
Synovitis reference image sheets (pages i12–i13, total 2). Reference images for MCP joint synovitis grades 0–3 are presented on two opposing pages. Examples are provided from the low end and high end of each grade. Synovitis is graded 0–3 (normal, mild, moderate, severe) as estimated by thirds of the presumed maximum volume of enhancing tissue as described in the OMERACT RAMRIS (see table 1, reference 17). The MRI set to be assessed should be compared with the axial precontrast and postcontrast T1 weighted reference images and the joint assigned the score of the best possible match. The first MCP joint should not be scored. All axial slices covering the joint should be taken into account. Each of the second to fifth MCP joint should be scored separately. A total score (range 0–12) can be calculated. The diagram above describes the positions and types of images included.
Synovitis reference image sheets (pages i12–i13, total 2). Reference images for MCP joint synovitis grades 0–3 are presented on two opposing pages. Examples are provided from the low end and high end of each grade. Synovitis is graded 0–3 (normal, mild, moderate, severe) as estimated by thirds of the presumed maximum volume of enhancing tissue as described in the OMERACT RAMRIS (see table 1, reference 17). The MRI set to be assessed should be compared with the axial precontrast and postcontrast T1 weighted reference images and the joint assigned the score of the best possible match. The first MCP joint should not be scored. All axial slices covering the joint should be taken into account. Each of the second to fifth MCP joint should be scored separately. A total score (range 0–12) can be calculated. The diagram above describes the positions and types of images included.
Synovitis reference image sheets (pages i12–i13, total 2). Reference images for MCP joint synovitis grades 0–3 are presented on two opposing pages. Examples are provided from the low end and high end of each grade. Synovitis is graded 0–3 (normal, mild, moderate, severe) as estimated by thirds of the presumed maximum volume of enhancing tissue as described in the OMERACT RAMRIS (see table 1, reference 17). The MRI set to be assessed should be compared with the axial precontrast and postcontrast T1 weighted reference images and the joint assigned the score of the best possible match. The first MCP joint should not be scored. All axial slices covering the joint should be taken into account. Each of the second to fifth MCP joint should be scored separately. A total score (range 0–12) can be calculated. The diagram above describes the positions and types of images included.
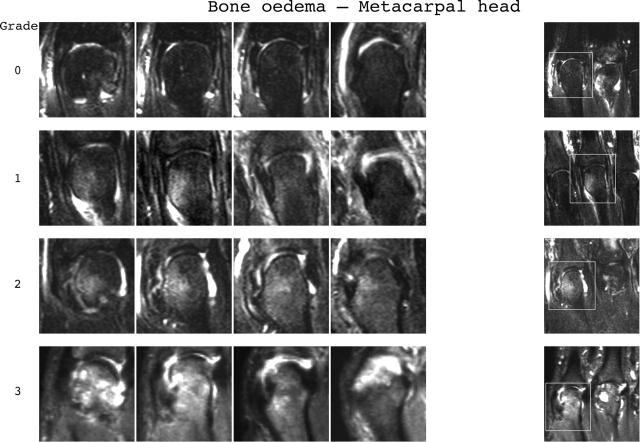
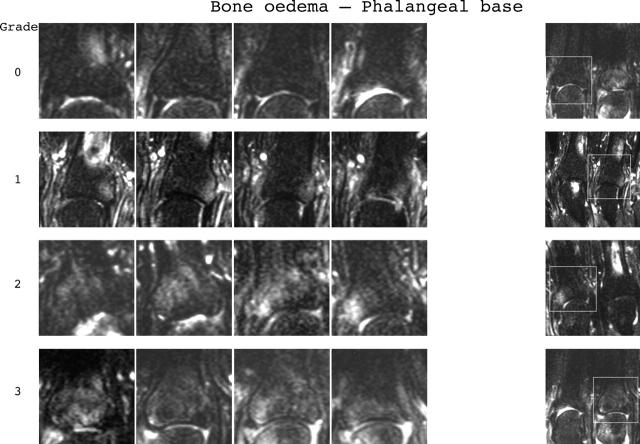
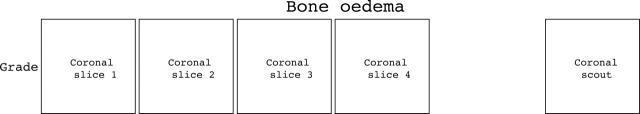
Bone oedema reference image sheets (pages i14–i15, total 2). Bone oedema in the metacarpal head and phalangeal base is illustrated on one single-page sheet each. All grades (0–3) are presented. Bone oedema grading is by percentage volume (0–3, by 33% volume increments) of the assessed bone as described in the OMERACT RAMRIS (see table 1, reference 11). The "assessed bone volume" is from the articular surface (or its best estimated position if absent) to a depth of 1 cm. All coronal slices covering the bone need to be assessed to estimate the percentage of the total volume occupied by the oedema. If erosion and oedema are concurrently present, oedema is scored as the proportion of the original bone. The T2 weighted fat saturated reference images of this atlas can be used for guidance and calibration. Each bone of the second to fifth MCP joint should be scored separately. A total score (range 0–24) can be calculated. The diagram above describes the types and positions of images presented.
Bone oedema reference image sheets (pages i14–i15, total 2). Bone oedema in the metacarpal head and phalangeal base is illustrated on one single-page sheet each. All grades (0–3) are presented. Bone oedema grading is by percentage volume (0–3, by 33% volume increments) of the assessed bone as described in the OMERACT RAMRIS (see table 1, reference 11). The "assessed bone volume" is from the articular surface (or its best estimated position if absent) to a depth of 1 cm. All coronal slices covering the bone need to be assessed to estimate the percentage of the total volume occupied by the oedema. If erosion and oedema are concurrently present, oedema is scored as the proportion of the original bone. The T2 weighted fat saturated reference images of this atlas can be used for guidance and calibration. Each bone of the second to fifth MCP joint should be scored separately. A total score (range 0–24) can be calculated. The diagram above describes the types and positions of images presented.
Bone oedema reference image sheets (pages i14–i15, total 2). Bone oedema in the metacarpal head and phalangeal base is illustrated on one single-page sheet each. All grades (0–3) are presented. Bone oedema grading is by percentage volume (0–3, by 33% volume increments) of the assessed bone as described in the OMERACT RAMRIS (see table 1, reference 11). The "assessed bone volume" is from the articular surface (or its best estimated position if absent) to a depth of 1 cm. All coronal slices covering the bone need to be assessed to estimate the percentage of the total volume occupied by the oedema. If erosion and oedema are concurrently present, oedema is scored as the proportion of the original bone. The T2 weighted fat saturated reference images of this atlas can be used for guidance and calibration. Each bone of the second to fifth MCP joint should be scored separately. A total score (range 0–24) can be calculated. The diagram above describes the types and positions of images presented.
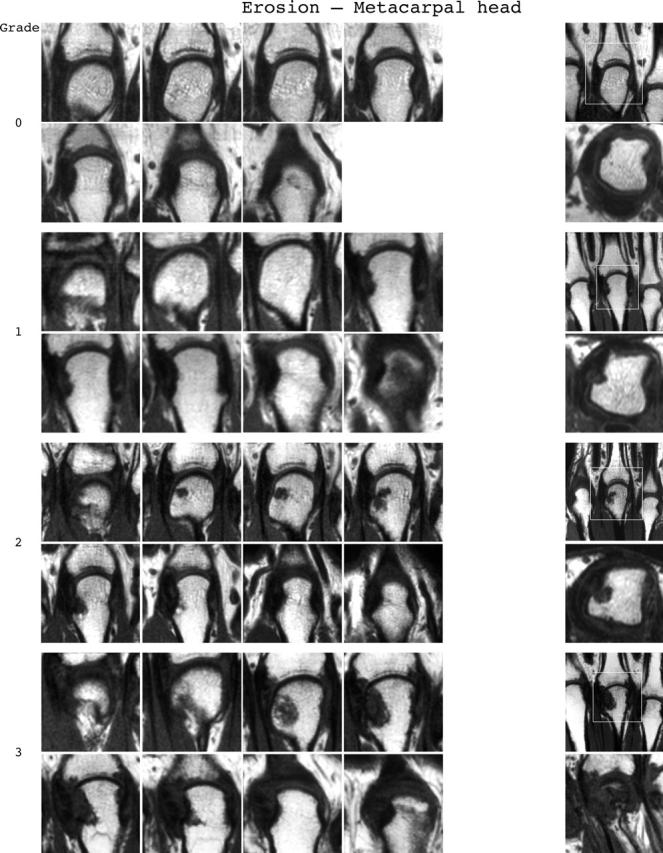
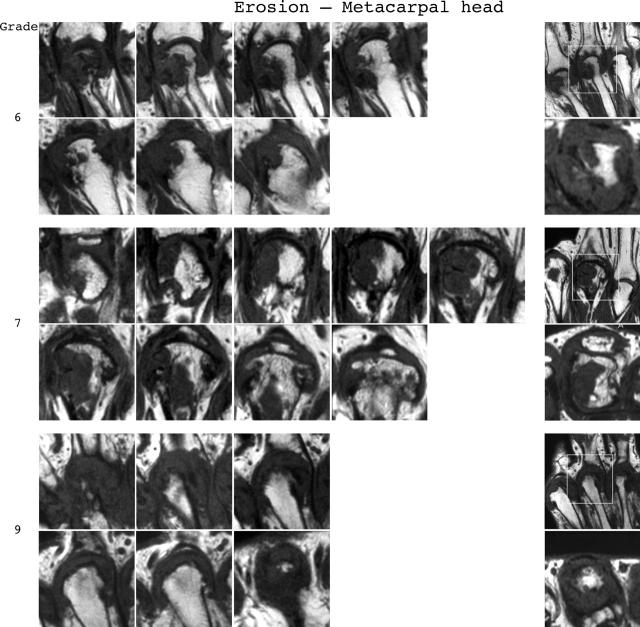
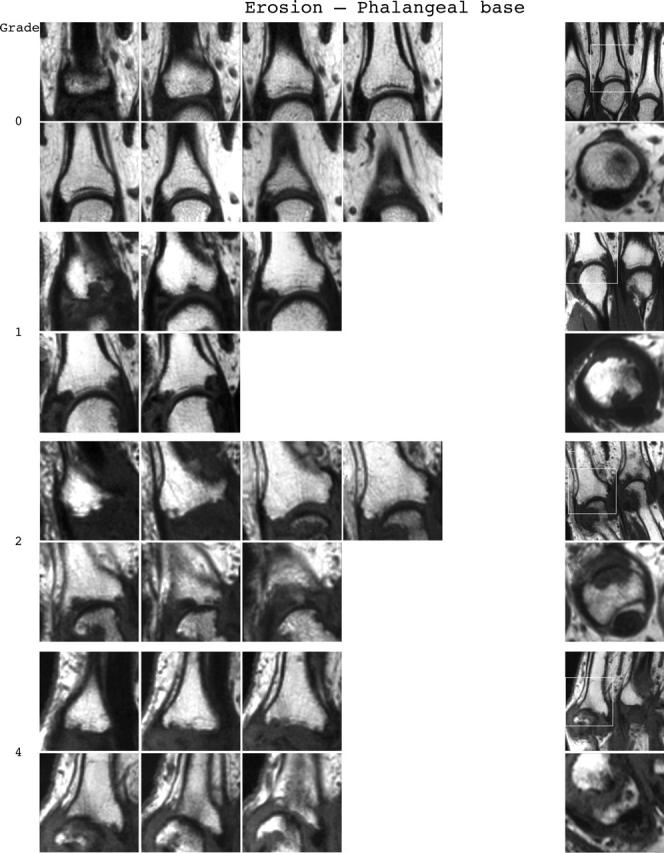
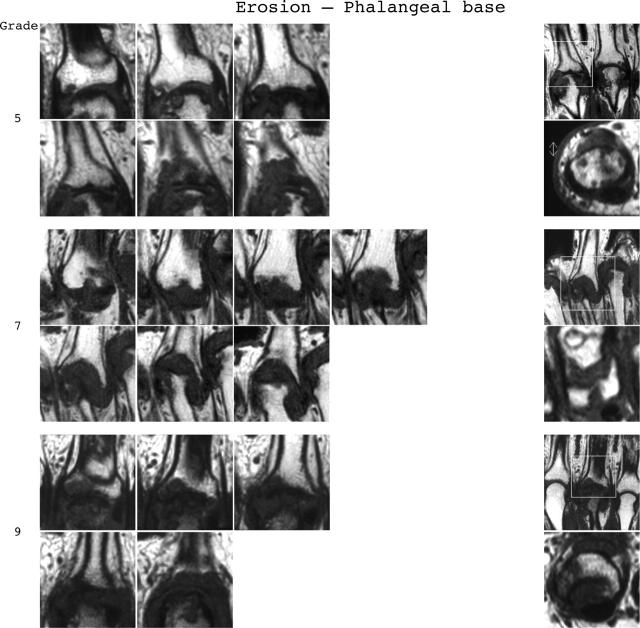
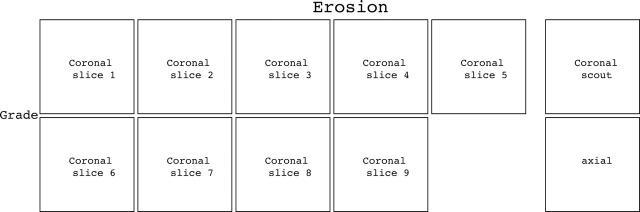
Bone erosion reference image sheets (pages i16–i19, total 4). Bone erosion in the metacarpal head and phalangeal base is illustrated on two single-page sheets each. Grades 0–3 supplemented with examples of three higher grades are presented. Bone erosion grading is by percentage volume (0–10, by 10% volume increments) of the assessed bone volume as described in the OMERACT RAMRIS (see table 1, reference 11). The "assessed bone volume" is defined as described above. The atlas reference images can be used for guidance and calibration. All coronal slices covering the bone should be assessed to estimate the percentage of the total volume occupied by the erosion. The varying number of coronal slices needed to cover the bone reflects varying bone sizes and varying slice thickness (1.5–3 mm). A total score (range 0–80) can be calculated. The diagram above describes the types and positions of images presented.
Bone erosion reference image sheets (pages i16–i19, total 4). Bone erosion in the metacarpal head and phalangeal base is illustrated on two single-page sheets each. Grades 0–3 supplemented with examples of three higher grades are presented. Bone erosion grading is by percentage volume (0–10, by 10% volume increments) of the assessed bone volume as described in the OMERACT RAMRIS (see table 1, reference 11). The "assessed bone volume" is defined as described above. The atlas reference images can be used for guidance and calibration. All coronal slices covering the bone should be assessed to estimate the percentage of the total volume occupied by the erosion. The varying number of coronal slices needed to cover the bone reflects varying bone sizes and varying slice thickness (1.5–3 mm). A total score (range 0–80) can be calculated. The diagram above describes the types and positions of images presented.
Bone erosion reference image sheets (pages i16–i19, total 4). Bone erosion in the metacarpal head and phalangeal base is illustrated on two single-page sheets each. Grades 0–3 supplemented with examples of three higher grades are presented. Bone erosion grading is by percentage volume (0–10, by 10% volume increments) of the assessed bone volume as described in the OMERACT RAMRIS (see table 1, reference 11). The "assessed bone volume" is defined as described above. The atlas reference images can be used for guidance and calibration. All coronal slices covering the bone should be assessed to estimate the percentage of the total volume occupied by the erosion. The varying number of coronal slices needed to cover the bone reflects varying bone sizes and varying slice thickness (1.5–3 mm). A total score (range 0–80) can be calculated. The diagram above describes the types and positions of images presented.
Bone erosion reference image sheets (pages i16–i19, total 4). Bone erosion in the metacarpal head and phalangeal base is illustrated on two single-page sheets each. Grades 0–3 supplemented with examples of three higher grades are presented. Bone erosion grading is by percentage volume (0–10, by 10% volume increments) of the assessed bone volume as described in the OMERACT RAMRIS (see table 1, reference 11). The "assessed bone volume" is defined as described above. The atlas reference images can be used for guidance and calibration. All coronal slices covering the bone should be assessed to estimate the percentage of the total volume occupied by the erosion. The varying number of coronal slices needed to cover the bone reflects varying bone sizes and varying slice thickness (1.5–3 mm). A total score (range 0–80) can be calculated. The diagram above describes the types and positions of images presented.
Bone erosion reference image sheets (pages i16–i19, total 4). Bone erosion in the metacarpal head and phalangeal base is illustrated on two single-page sheets each. Grades 0–3 supplemented with examples of three higher grades are presented. Bone erosion grading is by percentage volume (0–10, by 10% volume increments) of the assessed bone volume as described in the OMERACT RAMRIS (see table 1, reference 11). The "assessed bone volume" is defined as described above. The atlas reference images can be used for guidance and calibration. All coronal slices covering the bone should be assessed to estimate the percentage of the total volume occupied by the erosion. The varying number of coronal slices needed to cover the bone reflects varying bone sizes and varying slice thickness (1.5–3 mm). A total score (range 0–80) can be calculated. The diagram above describes the types and positions of images presented.
References
Publication types
MeSH terms
LinkOut - more resources
Full Text Sources
Medical
Miscellaneous
