. 2005 Jan 12;25(2):372-83.
doi: 10.1523/JNEUROSCI.4035-04.2005.

Relationship of brain-derived neurotrophic factor and its receptor TrkB to altered inhibitory prefrontal circuitry in schizophrenia

Affiliations

Relationship of brain-derived neurotrophic factor and its receptor TrkB to altered inhibitory prefrontal circuitry in schizophrenia

Takanori Hashimoto et al. J Neurosci. .

Abstract

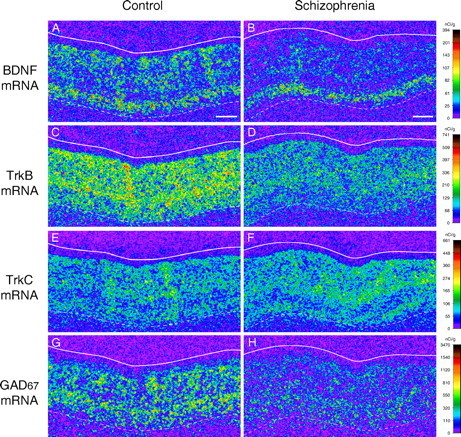
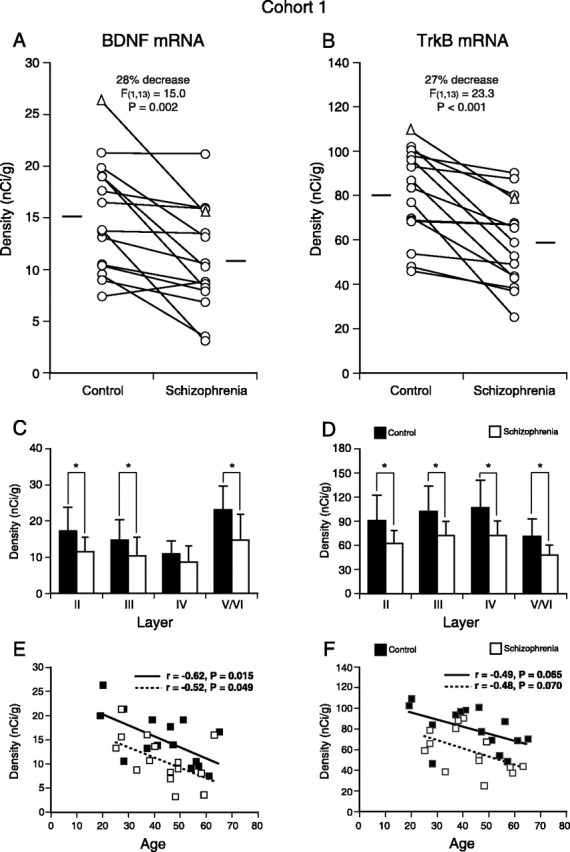
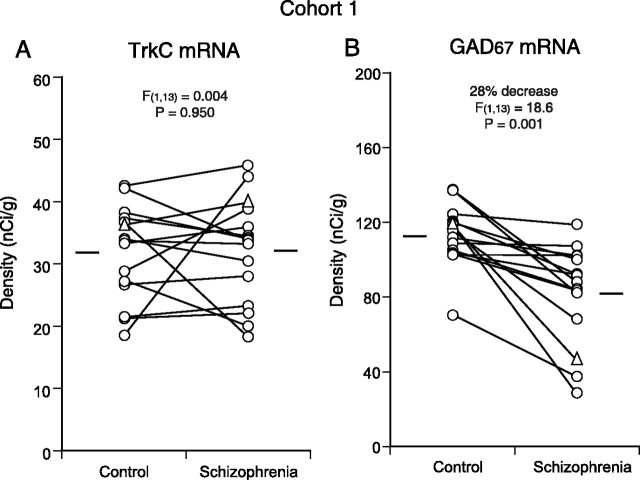
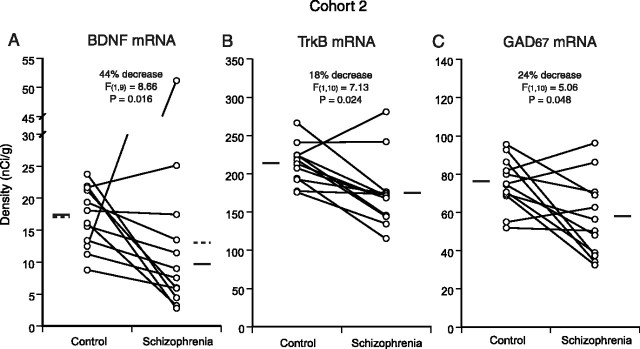
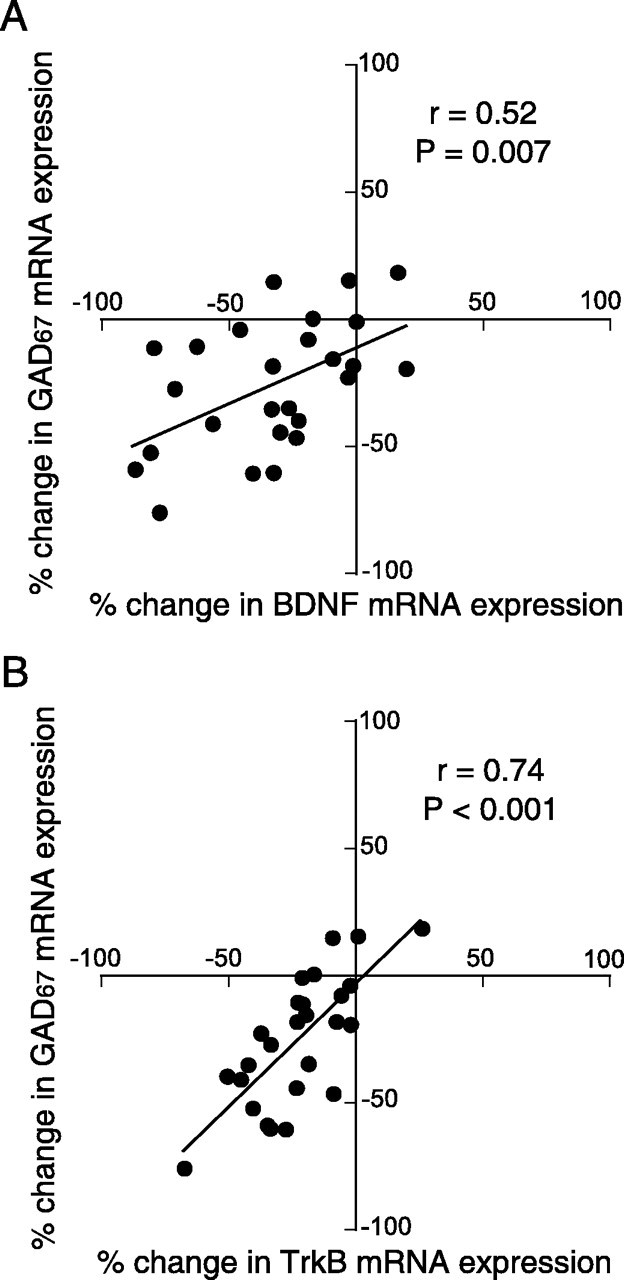
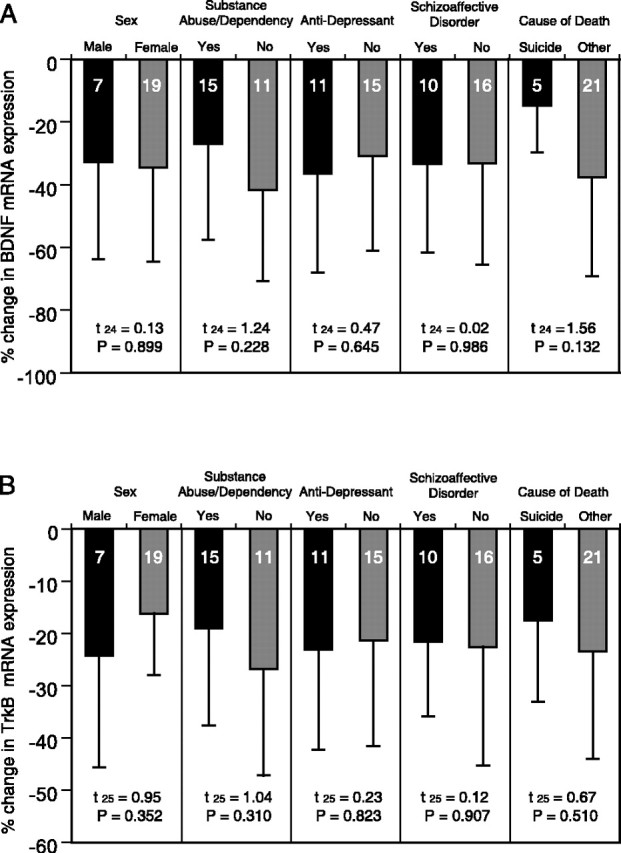
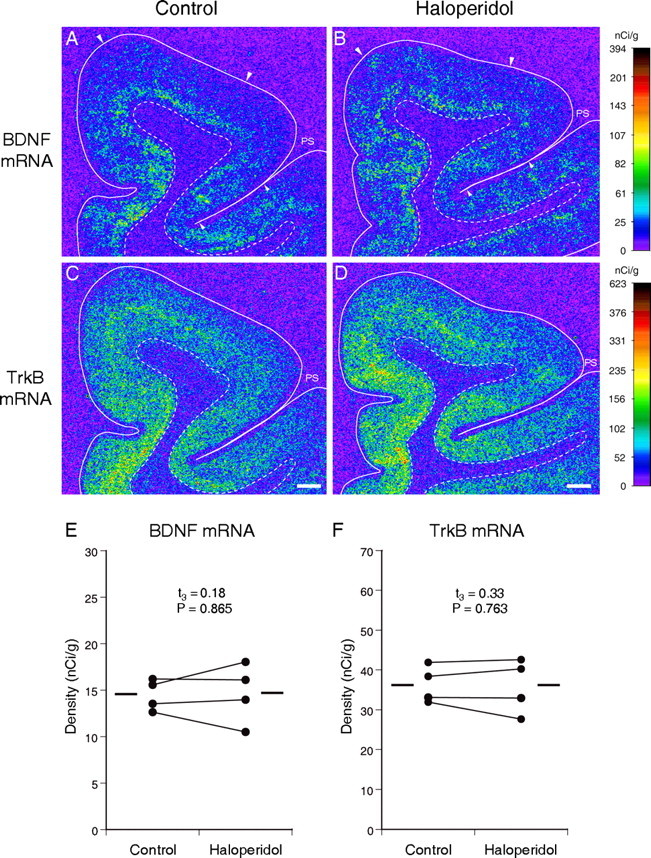
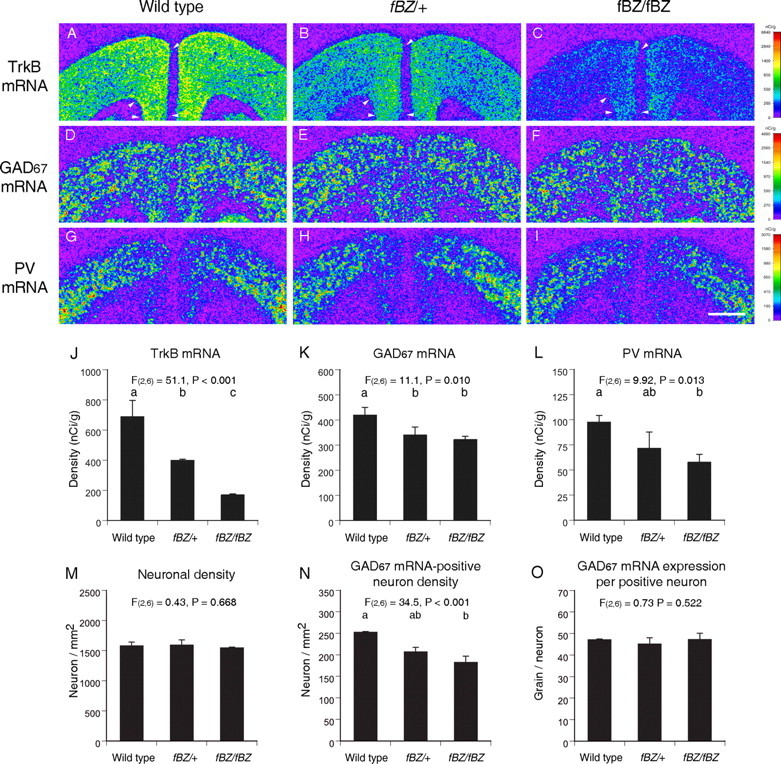
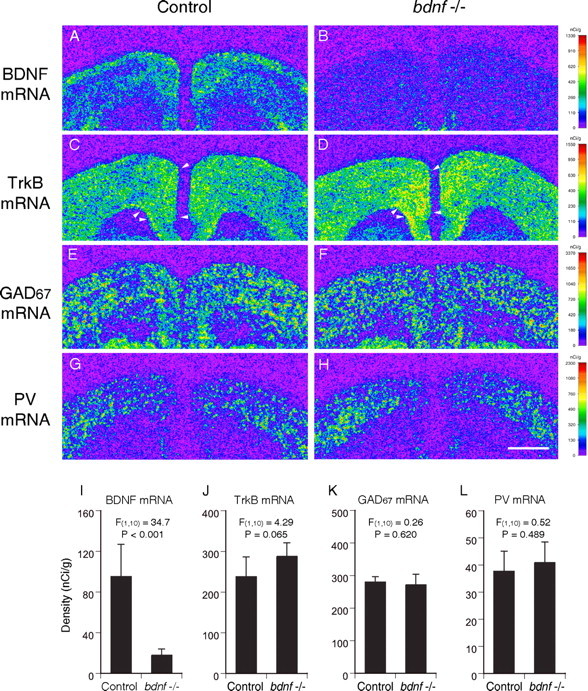
Dysfunction of inhibitory neurons in the prefrontal cortex (PFC), represented by decreased expression of GABA-related genes such as the 67 kDa isoform of glutamate decarboxylase (GAD67) and parvalbumin (PV), appears to contribute to cognitive deficits in subjects with schizophrenia. We investigated the involvement of signaling mediated by brain-derived neurotrophic factor (BDNF) and its receptor tyrosine kinase TrkB in producing the altered GABA-related gene expression in schizophrenia. In 15 pairs of subjects with schizophrenia and matched control subjects, both BDNF and TrkB mRNA levels, as assessed by in situ hybridization, were significantly decreased in the PFC of the subjects with schizophrenia, whereas the levels of mRNA encoding the receptor tyrosine kinase for neurotrophin-3, TrkC, were unchanged. In this cohort, within-pair changes in TrkB mRNA levels were significantly correlated with those in both GAD67 and PV mRNA levels. Decreased BDNF, TrkB, and GAD67 mRNA levels were replicated in a second cohort of 12 subject pairs. In the combined cohorts, the correlation between within-pair changes in TrkB and GAD67 mRNA levels was significantly stronger than the correlation between the changes in BDNF and GAD67 mRNA levels. Neither BDNF nor TrkB mRNA levels were changed in the PFC of monkeys after a long-term exposure to haloperidol. Genetically introduced decreases in TrkB expression, but not in BDNF expression, also resulted in decreased GAD67 and PV mRNA levels in the PFC of adult mice; in addition, the cellular pattern of altered GAD67 mRNA expression paralleled that present in schizophrenia. Decreased TrkB signaling appears to underlie the dysfunction of inhibitory neurons in the PFC of subjects with schizophrenia.


Figures

Figure 1.
Figure 1.
Gene expression in the PFC of control and schizophrenia subjects. Representative autoradiograms illustrating the expression of BDNF (A, B), TrkB (C, D), TrkC (E, F), and GAD67 (G, H) mRNAs in PFC area 9 of a control subject (A, C, E, G) and an age-, sex-, and PMI-matched subject with schizophrenia (B, D, F, H) from the subject pair indicated by the triangle in Figures 2 and 3 are shown. The densities of hybridization signals are presented in a pseudocolor manner according to the calibration scales (right) for each mRNA. Expression levels of BDNF and TrkB mRNAs are reduced in the schizophrenia subject (B, D) compared with the control subject (A, C), whereas TrkC mRNA expression levels appear similar between the control (E) and schizophrenia (F) subjects. GAD67 mRNA expression is also reduced in the schizophrenia subject (H) compared with the control subject (G). Solid and broken lines indicate the pial surface and the border between gray matter and white matter, respectively. Scale bars (in A, B), 1 mm.
Figure 2.
Figure 2.
Reduced BDNF and TrkB mRNA expression in the PFC of subjects with schizophrenia in cohort 1. A, B, Comparisons of the mRNA expression levels for BDNF (A) and TrkB (B) by film optical density in PFC area 9 of subjects with schizophrenia and age-, sex-, and PMI-matched control subjects. The triangles represent the data for the pair presented in Figure 1. The expression levels of BDNF and TrkB mRNAs are decreased in the subjects with schizophrenia for 14 and 15 of the pairs, respectively. The mean values for each subject group are indicated by horizontal bars. C, D, Mean ± SD expression levels of BDNF (C) and TrkB (D) mRNAs for each cortical layer. BDNF mRNA expression levels were significantly decreased by 33, 29, and 37% in layers II, III, and V/VI, respectively. The expression levels of TrkB mRNA were significantly decreased by 31, 29, 33, and 32% in layers II, III, IV, and V/VI, respectively. *p < 0.005. E, F, The expression levels of BDNF (E) and TrkB (F) mRNAs are plotted against age for each subject. For both mRNAs, expression levels are negatively correlated with age, and the regression lines for schizophrenia subjects are parallel to and shifted downward from those for control subjects, suggesting that the decreased expression of these mRNAs is similar in magnitude across adult life. These age-dependent changes, similarly affecting both control and schizophrenia subjects, may contribute to the relatively large overlaps in the distributions of the mRNA expression levels between the control and schizophrenia groups in A and B.
Figure 3.
Figure 3.
Comparisons of TrkC and GAD67 mRNA expression in the PFC in cohort 1. The expression level of TrkC mRNA did not differ between the control and schizophrenia groups (A), whereas the expression of GAD67 mRNA (B) was significantly decreased in the schizophrenia group. In all 15 subject pairs, GAD67 mRNA expression levels were decreased in the subjects with schizophrenia relative to the matched control subjects. The triangles represent the data for the pair presented in Figure 1. The mean values for each subject group are indicated by horizontal bars.
Figure 4.
Figure 4.
Replication of the gene expression differences in cohort 2. A, Decreased BDNF mRNA expression in PFC area 9 of schizophrenia subjects in cohort 2. Pair 5 was excluded from the analysis because the schizophrenia subject showed an abnormally high level of BDNF mRNA expression in association with an antidepressant overdose. B, C, Decreased expression levels of TrkB (B) and GAD67 (C) mRNAs in schizophrenia subjects of cohort 2. The mean mRNA values for each subject group are indicated by solid horizontal bars. The broken lines in A indicate mean values across subjects, including pair 5.
Figure 5.
Figure 5.
Associations between the differences in BDNF or TrkB mRNA expression and in GAD67 mRNA expression across subject pairs. The within-pair percentage of changes in GAD67 mRNA expression is plotted against those for BDNF (A) or TrkB (B) mRNA expression for 26 subject pairs (excluding pair 5 in cohort 2). The changes in both BDNF and TrkB mRNA expression are significantly correlated with the change in GAD67 mRNA expression across the 26 subject pairs. The expression changes in TrkB mRNA were more highly correlated with the expression changes in GAD67 mRNA than were the expression changes in BDNF mRNA.
Figure 6.
Figure 6.
The effects of confounding factors on the expression changes in BDNF and TrkB mRNAs in schizophrenia. Mean ± SD percentage of differences from control subjects for BDNF (A) and TrkB (B) mRNAs within subject pairs grouped by potential confounding factors in subjects with schizophrenia. Neither sex, substance abuse/dependence history, history of antidepressant medications, diagnosis of schizoaffective disorder, nor cause of death significantly affected the expression changes in BDNF or TrkB mRNAs. For the comparison of BDNF mRNA expression change (A), pair 5 in cohort 2 was excluded. The numbers within each bar indicate the number of subject pairs.
Figure 7.
Figure 7.
The effects of long-term exposure to haloperidol on expression of BDNF and TrkB mRNAs in monkey PFC. Representative autoradiograms illustrating the expression of BDNF (A, B) and TrkB (C, D) mRNAs in a control monkey (A, C) and an age-, sex-, and body weight-matched monkey exposed chronically to haloperidol (B, D). The densities of hybridization signals are presented in a pseudocolor manner according to the calibration scales (right) for each mRNA. For both mRNAs, the signal densities and distribution patterns appear to be unchanged in the PFC of the haloperidol-exposed monkey (B, D) compared with the control monkey (A, C). Solid and broken lines indicate the pial surface and the border between gray and white matter, respectively. PS, Principal sulcus. Pairs of large and small arrowheads (A, B) indicate the quantified regions in areas 9 and 46, respectively. Scale bars (in C, D), 1 mm. E, F, Pairwise comparisons of the mRNA expression levels for BDNF (E) and TrkB (F) in PFC area 9 between monkeys exposed to haloperidol and their sex-, age-, and weight-matched controls. The mean values for each group are indicated by horizontal bars.
Figure 8.
Figure 8.
Gene expression changes in the PFC of mice with decreased TrkB expression. A-I, Representative autoradiograms illustrating TrkB (A-C), GAD67 (D-F), and PV (G-I) mRNA expression in a wild-type mouse (left), a mouse heterozygous for the fBZ locus (fBZ/+) (middle), and a mouse homozygous for the fBZ locus (fBZ/fBZ) (right) in adulthood. The densities of hybridization signals are presented in a pseudocolor manner according to the calibration scales (right) for each mRNA. Note that TrkB mRNA is expressed in proportion to the gene dose (A-C). GAD67 and PV mRNA expression levels appear to be decreased in the PFC of the fBZ/fBZ mouse (F, I), in which the expression of TrkB mRNA is remarkably decreased (C). The arrowheads in A-C indicate the quantified regions in the PFC (applies to all sections from each mouse). Scale bar (in I), 1 mm. J-L, Mean ± SD expression levels of TrkB (J), GAD67 (K), and PV (L) mRNAs in the PFC of adult mice with wild-type, fBZ/+, or fBZ/fBZ genotypes. M-O, Mean ± SD neuronal density (M), GAD67 mRNA-positive neuron density (N), and GAD67 mRNA expression per positive neuron (O). Bars not sharing the same alphabetical letter are statistically different (p < 0.05; post hoc Tukey's multiple comparison).
Figure 9.
Figure 9.
Gene expression in the PFC of mice with an inducible neuron-specific bdnf knock-out in embryogenesis. Representative autoradiograms (A-H) illustrating the expression of BDNF (A, B), and TrkB (C, D), GAD67 (E, F), and PV (G, H) mRNAs in a control mouse (A, C, E, G) and a mouse with embryonic bdnf knock-out (B, D, F, H) at 5 month of age are shown. The densities of hybridization signals are presented in a pseudocolor manner according to the calibration scales (right) for each mRNA. Note that BDNF mRNA expression was dramatically decreased in the knock-out mouse (B) compared with the control (A). GAD67 (E, F) and PV (G, H) mRNA expression levels appear to be similar between knock-out and control mice, whereas the expression level of TrkB mRNA is higher in the knock-out mouse (D) than the control mouse (C). The arrowheads in C and D indicate the quantified regions in the PFC in all sections from each mouse. Scale bar (in H), 1 mm. I-L, Mean ± SD expression levels of BDNF (I), TrkB (J), GAD67 (K), and PV (L) mRNAs in control and embryonic bdnf knock-out mice. Although BDNF mRNA expression levels are significantly decreased by 80% in embryonic knock-out mice (I), the expression levels of both GAD67 and PV mRNAs are unchanged (K, L). The expression level of TrkB mRNA is increased by 20% in embryonic knock-out mice with marginal significance.

References

    1. Akbarian S, Kim JJ, Potkin SG, Hagman JO, Tafazzoli A, Bunney Jr WE, Jones EG (1995) Gene expression for glutamic acid decarboxylase is reduced without loss of neurons in prefrontal cortex of schizophrenics. Arch Gen Psychiatry 52: 258-266. - PubMed
    1. Alcantara S, Frisen J, del Rio JA, Soriano E, Barbacid M, Silos-Santiago I (1997) TrkB signaling is required for postnatal survival of CNS neurons and protects hippocampal and motor neurons from axotomy-induced cell death. J Neurosci 17: 3623-3633. - PMC - PubMed
    1. Angelucci F, Mathe AA, Aloe L (2000) Brain-derived neurotrophic factor and tyrosine kinase receptor trkB in rat brain are significantly altered after haloperidol and risperidone administration. J Neurosci Res 60: 783-794. - PubMed
    1. Arenas E, Akerud P, Wong V, Boylan C, Persson H, Lindsay RM, Altar CA (1996) Effects of BDNF and NT-4/5 on striatonigral neuropeptides or nigral GABA neurons in vivo. Eur J Neurosci 8: 1707-1717. - PubMed
    1. Beasley CL, Zhang ZJ, Patten I, Reynolds GP (2002) Selective deficits in prefrontal cortical GABAergic neurons in schizophrenia defined by the presence of calcium-binding proteins. Biol Psychiatry 52: 708-715. - PubMed

Publication types

MeSH terms