. 2005 Jan 12;25(2):514-23.
doi: 10.1523/JNEUROSCI.3369-04.2005.

Distinct properties of stimulus-evoked bursts in the lateral geniculate nucleus

Affiliations

Distinct properties of stimulus-evoked bursts in the lateral geniculate nucleus

Henry J Alitto et al. J Neurosci. .

Abstract

Neurons in the lateral geniculate nucleus (LGN) of the thalamus produce spikes that can be classified as burst spikes and tonic spikes. Although burst spikes are generally associated with states of sleep and drowsiness, bursts may also play an important role in sensory processing. This study explores the stimulus properties that evoke burst and tonic spikes and examines the reliability of LGN neurons to produce visually driven bursts. Using reverse-correlation techniques, we show that the receptive fields of burst spikes are similar to, but significantly different from, the receptive fields of tonic spikes. Compared with tonic spikes, burst spikes (1) occur with a shorter latency between stimulus and response, (2) have a greater dependence on stimuli with transitions from suppressive to preferred states, and (3) prefer stimuli that provide increased drive to the receptive field center and even greater increased drive to the receptive field surround. These differences are not attributable to the long interspike interval that precedes burst spikes, because tonic spikes with similar preceding interspike intervals also differ from burst spikes in both the spatial and temporal domains. Finally, measures of reliability are significantly greater for burst spikes than for tonic spikes with similar preceding interspike intervals. These results demonstrate that thalamic bursts contribute to sensory processing and can reliably provide the cortex with information that is similar to, but distinct from, that of tonic spikes.


Figures

Figure 3.
Figure 3.
Spike-triggered averages. A, Features of the spike-triggered average were used to quantify temporal properties of the average stimulus to evoke burst, tonic, and long-ISI tonic spikes. B, Spike-triggered averages for burst spikes and tonic spikes from three representative LGN neurons. C, Spike-triggered averages for burst spikes and long-ISI tonic spikes from the same three representative neurons. Only bursts with ISIs that match those of long-ISI tonic spikes were included in this analysis.
Figure 1.
Figure 1.
Receptive field maps and DOG fits calculated from the burst spikes, tonic spikes, and long-ISI tonic spikes of a representative LGN neuron. A, B, Receptive fields and corresponding DOG fits at the latency between stimulus and response that evoked a maximal center response (tonic spikes, 21.4-28.5 msec; burst spikes, 14.3-21.4 msec; long-ISI tonic spikes, 21.4-28.5 msec). C, D, Receptive fields and corresponding DOG fits 7.1 msec after the maximal center response. Receptive fields were calculated from responses to a white-noise stimulus using reverse-correlation analysis. On responses are shown in red, and off responses are shown in blue.
Figure 2.
Figure 2.
Spatial properties of the average stimulus to evoke burst spikes are significantly different from those that evoke tonic and long-ISI tonic spikes. A, The surround/center ratio of the average stimulus to evoke burst spikes is significantly greater than that for tonic spikes. B, Both the surround and center subunits are stronger for burst spikes than for tonic spikes; however, the increase in surround strength is greater than the increase in center strength. Error bars represent SEM. C, The surround/center ratio of the average stimulus to evoke burst spikes is significantly greater than that for long-ISI tonic spikes. D, Spatial maps of a model LGN receptive field convolved with the white-noise stimulus under low spike-threshold and high spike-threshold conditions (see Materials and Methods). The surround/center ratio is greater for the high threshold condition (0.25) compared with the low threshold condition (0.06).
Figure 4.
Figure 4.
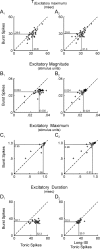
The excitatory phase of the spike-triggered average differs significantly for burst spikes compared with tonic spikes and long-ISI tonic spikes. A1, A2, The latency from excitatory phase maximum to neuronal response was significantly less for burst spikes compared with tonic spikes (A1) but not less for burst spikes compared with long-ISI tonic spikes (A2). B1, B2, The magnitude of the excitatory phase was significantly less for burst spikes compared with tonic spikes (B1) but not less for burst spikes compared with long-ISI tonic spikes (B2). The difference in excitatory phase magnitude did not reflect differences in the excitatory phase maximum of burst spikes compared with tonic spikes (C1) or long-ISI tonic spikes (C2) but did reflect differences in the duration of burst spikes compared with tonic spikes (D1) and long-ISI tonic spikes (D2).
Figure 5.
Figure 5.
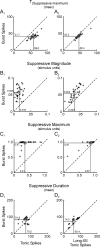
The suppressive phase of the spike-triggered average differs significantly for burst spikes compared with tonic spikes and long-ISI tonic spikes. A1, A2, The latency from suppressive phase maximum to neuronal response was significantly less for burst spikes compared with tonic spikes (A1) and long-ISI tonic spikes (A2). B1, B2, The magnitude of the suppressive phase was significantly greater for burst spikes compared with tonic spikes (B1) and long-ISI tonic spikes (B2). The difference in suppressive phase magnitude of burst spikes reflects increases in the suppressive phase maximum of burst spikes compared with tonic spikes (C1) and long-ISI tonic spikes (C2) and increases in the duration of burst spikes compared with tonic spikes (D1) and long-ISI tonic spikes (D2).
Figure 6.
Figure 6.
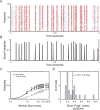
Burst spikes are reliable and temporally precise across multiple repeats of the same visual stimulus. A, Responses of a representative LGN neuron (reliability index = 0.77) presented with multiple repeats of the same 5 sec clip of the m-sequence modulated, contrast-reversing, sine-wave stimulus. Each line in the raster represents a different presentation of the visual stimulus. Cardinal spikes of a burst are indicated in red, and tonic spikes are indicated in blue. B, Burst probability as a function of time for the 5 sec period shown in A. Burst probability was calculated using the cardinal spike of each burst and a sliding 10 msec window. C, Reliability (see Materials and Methods) is greater for burst spikes (black curve) compared with long-ISI tonic spikes (gray curve) over a range of temporal windows (1-20 msec). Error bars represent SEM. D, Cardinal spikes of bursts are temporally precise, as indicated from measures of the SD of burst peaks in burst probability plots (i.e., the peaks shown in B). Only peaks with >25% reliability were used for this analysis. As a result, 21 of 26 cells are shown. The dashed line indicates the population mean.
Figure 7.
Figure 7.
Relationship between burst reliability and burst rate. A, Histogram showing the distribution of burst reliability values for 26 neurons. Neurons with reliability values above and below 0.4 are arbitrarily divided into high and low burst categories, respectively. B, Burst reliability is correlated with burst rate; however, a small population of LGN neurons with low burst rate have high burst reliability.

Similar articles

Cited by

References

    1. Albrecht DG (1995) Visual cortex neurons in monkey and cat: effect of contrast on the spatial and temporal phase transfer functions. Vis Neurosci 12: 1191-1210. - PubMed
    1. Benardete EA, Kaplan E, Knight BW (1992) Contrast gain control in the primate retina: P cells are not X-like, some M cells are. Vis Neurosci 8: 483-486. - PubMed
    1. Bishop PO, Burke W, Davis R (1958) Synapse discharge by single fibre in mammalian visual system. Nature 128: 728-730. - PubMed
    1. Boudreau DE, Ferster D (2003) Synaptic depression in thalamocortical synapses of the cat visual cortex. Soc Neurosci Abstr 29: 484.11. - PMC - PubMed
    1. Carandini M, Heeger DJ (1994) Summation and division by neurons in primate visual cortex. Science 264: 1333-1336. - PubMed

Publication types