. 2005 Mar 1;563(Pt 2):345-58.
doi: 10.1113/jphysiol.2004.080028. Epub 2005 Jan 13.

Subunit-specific gating controls rat NR1/NR2A and NR1/NR2B NMDA channel kinetics and synaptic signalling profiles

Affiliations

Subunit-specific gating controls rat NR1/NR2A and NR1/NR2B NMDA channel kinetics and synaptic signalling profiles

Kevin Erreger et al. J Physiol. .

Abstract

NR2A and NR2B are the predominant NR2 NMDA receptor subunits expressed in cortex and hippocampus. The relative expression level of NR2A and NR2B is regulated developmentally and these two subunits have been suggested to play distinct roles in long-term synaptic plasticity. We have used patch-clamp recording of recombinant NMDA receptors expressed in HEK293 cells to characterize the activation properties of both NR1/NR2A and NR1/NR2B receptors. Recordings from outside-out patches that contain a single active channel show that NR2A-containing receptors have a higher probability of opening at least once in response to a brief synaptic-like pulse of glutamate than NR2B-containing receptors (NR2A, 0.80; NR2B, 0.56), a higher peak open probability (NR2A, 0.50; NR2B, 0.12), and a higher open probability within an activation (NR2A, 0.67; NR2B, 0.37). Analysis of the sequence of single-channel open and closed intervals shows that both NR2A- and NR2B-containing receptors undergo multiple conformational changes prior to opening of the channel, with at least one of these steps being faster for NR2A than NR2B. These distinct properties produce profoundly different temporal signalling profiles for NR2A- and NR2B-containing receptors. Simulations of synaptic responses demonstrate that at low frequencies typically used to induce long-term depression (LTD; 1 Hz), NR1/NR2B makes a larger contribution to total charge transfer and therefore calcium influx than NR1/NR2A. However, under high-frequency tetanic stimulation (100 Hz; > 100 ms) typically used to induce long-term potentiation (LTP), the charge transfer mediated by NR1/NR2A considerably exceeds that of NR1/NR2B.


Figures

Figure 1
Figure 1. Activation of NR1/NR2A or NR1/NR2B channels in outside-out patches in response to a synaptic-like brief pulse of saturating glutamate
A and B, patches with only a single active NR1/NR2A or NR1/NR2B channel were exposed to a brief (3–8 ms) pulse of 1 mm glutamate in the continued presence of 50 μm glycine. The tip current used to determine the time course of solution exchange is plotted on the top trace. Twenty representative current responses from one patch are displayed for NR1/NR2A or NR1/NR2B channels (resampled at 2.5 kHz and filtered at 1 kHz for display; V =−80 mV for NR1/NR2A, −100 mV for NR1/NR2B). The mean current response for each patch was normalized to the unitary channel current to convert the waveform to an absolute open probability. This open probability waveform was averaged among six patches and the resulting composite open probability waveform is displayed below the individual current traces. The distribution of activation durations, defined as the total time between and including the first and last channel opening, is shown as an inset adjacent to the open probability mean waveform.
Figure 2
Figure 2. Steady-state NR1/NR2A currents in outside-out patches
A, steady-state recording of a patch with a single NR1/NR2A channel displayed on two different time scales (Vm =−80 mV, digitized at 40 kHz, filtered at 5 kHz). The box in the top trace highlights the region shown in detail in the bottom trace. The shut time duration histogram (B) of the same patch in (A) shows multiple exponential components described the histogram. The time constants are given in the inset with the percentage area for each component in parentheses. C, the distribution of shut durations pooled from six patches following a brief jump into saturating glutamate (see Figure 1) is plotted for comparison with the steady-state data in B.
Figure 3
Figure 3. Steady-state NR1/NR2B currents in outside-out patches
A, steady-state recording of a patch with a single NR1/NR2B channel displayed on two different time scales shows bursting behaviour (Vm =−100 mV, digitized at 40 kHz, filtered at 5 kHz). The box in the top trace highlights the region shown in detail in the bottom trace. B, the shut-time duration histogram of the same patch as in A shows multiple exponential components, with longer time constants reflecting recovery from desensitization. The time constants are given in the inset with the percentage area for each component in parentheses. C, the distribution of shut durations pooled from six patches following a brief jump into saturating glutamate (see Figure 1) is plotted for comparison with the steady-state data in B.
Figure 4
Figure 4. Maximum interval likelihood fitting of steady-state activations of NR1/NR2A or NR1/NR2B
A, kinetic models are depicted for each scheme with open-channel states in bold with a star. Scheme 1 postulates two independent pre-gating steps. Scheme 2 postulates two sequential pre-gating steps. Scheme 3 is an extension of Scheme 2 with an additional open and shut state to account for the briefest component of the dwell-time distributions. B, steady-state currents were idealized and fitted to Scheme 1. Bar graphs show dwell-time distribution histograms for one example patch for each subunit combination and solid lines show probability density functions predicted by model fits. Rate constant results from fits to all three models are given in Table 2.
Figure 5
Figure 5. Activation rate for NR1/NR2A and NR1/NR2B
A, the rising phase of the ensemble average from one-channel patches activated by brief concentration jump to maximally effective concentration of glutamate (1 mm). Average waveforms were normalized and superimposed; n = 6 patches for both NR1/NR2A and NR1/NR2B. B, cumulative first latency histogram was constructed for three patches for both NR1/NR2A (556 events) and NR1/NR2B (205 events). The cumulative distribution for the first 90 ms was normalized to 100%, and shows that NR2A activates faster than NR2B (P < 0.001; Kolmogorov-Smirnov).
Figure 6
Figure 6. Fitting of macroscopic currents to determine agonist binding and desensitization rates
A, macroscopic currents for curve fitting were recorded in outside-out patches excised from HEK293 cells expressing NR1/NR2A (Vm =−60 mV). One example sweep is shown for each of the three protocols: 1 mm glutamate brief pulse; 1 mm glutamate long pulse; and 5 μm glutamate long pulse. The inset shows the brief 1 mm glutamate response on an expanded time scale with the junction current used to determine the time course of solution exchange. B, the mean waveform for each protocol is shown for both NR1/NR2A and NR1/NR2B (grey, n = 11 NR1/NR2A, n = 17 NR1/NR2B). For NR2B the three protocols are: 1 mm glutamate brief pulse; 1 mm glutamate long pulse; and 3 μm glutamate long pulse. Fits to Scheme 4 are in black and raw data in grey are mean normalized currents. In the model there are two different desensitized states which are accessible from the fully liganded state (RA2 in Scheme 4). Kinetic parameters and fitting results are given in Table 3.
Figure 7
Figure 7. Subunit-specific gating controls NR2 subunit-dependent signalling properties
Models using Scheme 4 with the rates listed in Table 3 were used to simulate NR1/NR2A or NR1/NR2B response to synaptic inputs. A peak glutamate concentration of 1.1 mm with an exponential decay time constant of 1.2 ms was used to drive simulations (Clements et al. 1992). The response to a single synaptic pulse of glutamate is simulated for 20 channels at −60 mV under voltage clamp (50 pS conductance, with a reversal potential of 0 mV). Inset, the accumulated charge transfer for NR2A- and NR2B-containing receptors is calculated at varying time points of the current response following stimulation. The current response is plotted on the same time scale with arrows indicating the corresponding time point between the current response and the accumulated charge transfer. Calcium entry is proportional to charge transfer as the relative permeability for calcium is the same for NR1/NR2A and NR1/NR2B (Schneggenburger, 1996).
Figure 8
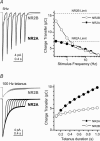
Figure 8. NR1/NR2A and NR1/NR2B show distinct frequency dependence of signalling
A, NR1/NR2A and NRI/NR2B receptor responses were simulated in response to trains of six synaptic pulses at 5 Hz (left panel). There is a clear difference in the amplitude of the current response to each pulse between NR1/NR2A and NR1/NR2B receptors. The right panel summarizes the total charge transfer (total area under the current curve for the entire train of six synaptic pulses) at different frequencies. The low-frequency limit of the charge transfer was calculated as six times the charge transfer to a single response, and is shown for both NR1/NR2A and NR1/NR2B (broken line). Low-frequency stimulation allows higher charge transfer, and therefore calcium entry, through NR1/NR2B receptors, whereas moderately higher stimulus frequencies lead to similar levels of overall charge transfer for the two subunits. B, summary of charge transfer for a 100-Hz tetanic stimulus train of a varying duration. High-frequency stimulation for > 100 ms produces greater charge transfer, and therefore calcium entry, through NR1/NR2A than NR1/NR2B receptors.

References

    1. Armstrong N, Gouaux E. Mechanisms for activation and antagonism of an AMPA-sensitive glutamate receptor: crystal structures of the GluR2 ligand binding core. Neuron. 2000;28:165–181. 10.1016/S0896-6273(00)00094-5. - DOI - PubMed
    1. Banke TG, Traynelis SF. Activation of NR1/NR2B NMDA receptors. Nat Neurosci. 2003;6:144–152. - PubMed
    1. Barbour B. An evaluation of synaptic independence. J Neurosci. 2001;20:7969–7984. - PMC - PubMed
    1. Brauner-Osborne H, Egebjerg J, Nielsen EO, Madsen U, Krogsgaard-Larsen P. Ligands for glutamate receptors: design and therapeutic prospects. J Med Chem. 2000;43:2609–2645. - PubMed
    1. Carmignoto G, Vicini S. Activity-dependent decrease in NMDA receptor responses during development of the visual cortex. Science. 1992;258:1007–1011. - PubMed

Publication types