

Genetic recombination of human immunodeficiency virus type 1 in one round of viral replication: effects of genetic distance, target cells, accessory genes, and lack of high negative interference in crossover events
- PMID: 15650192
- PMCID: PMC544095
- DOI: 10.1128/JVI.79.3.1666-1677.2005
Genetic recombination of human immunodeficiency virus type 1 in one round of viral replication: effects of genetic distance, target cells, accessory genes, and lack of high negative interference in crossover events
Abstract
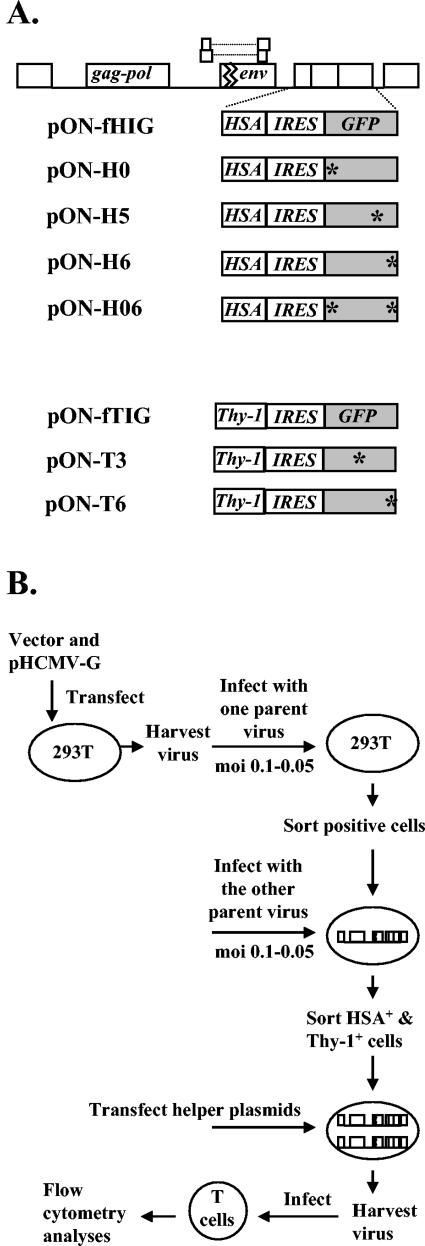
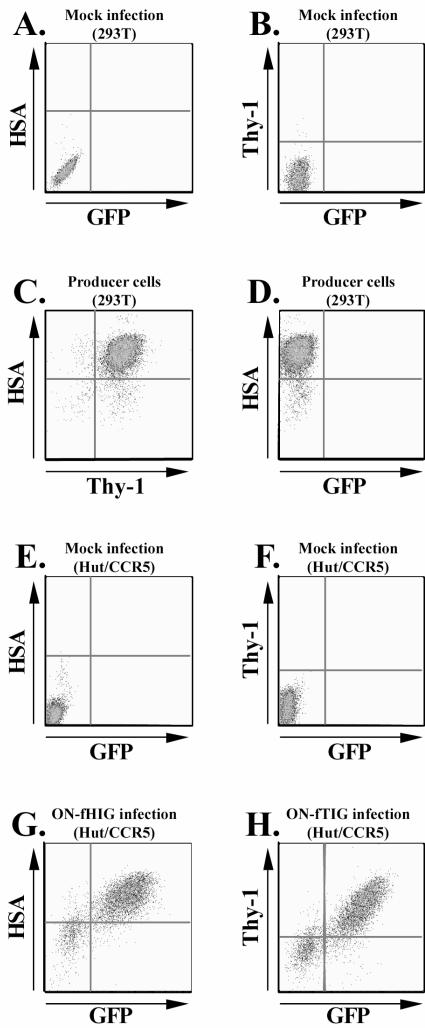
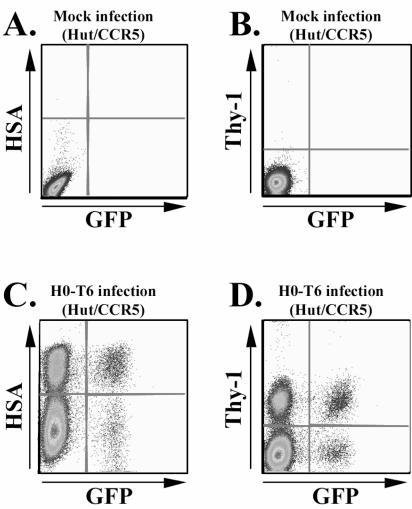
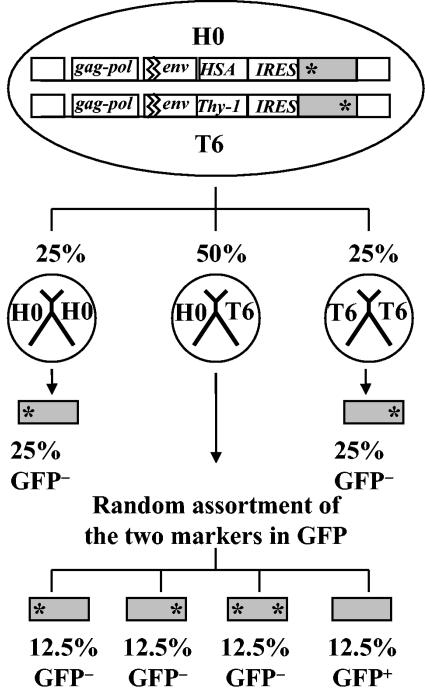
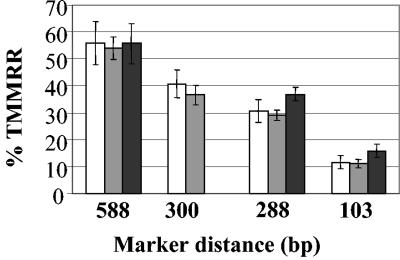
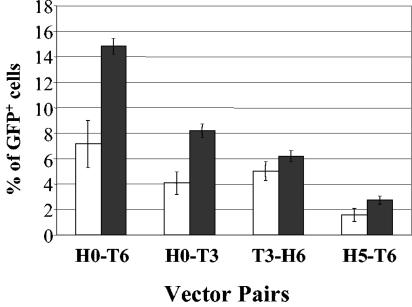
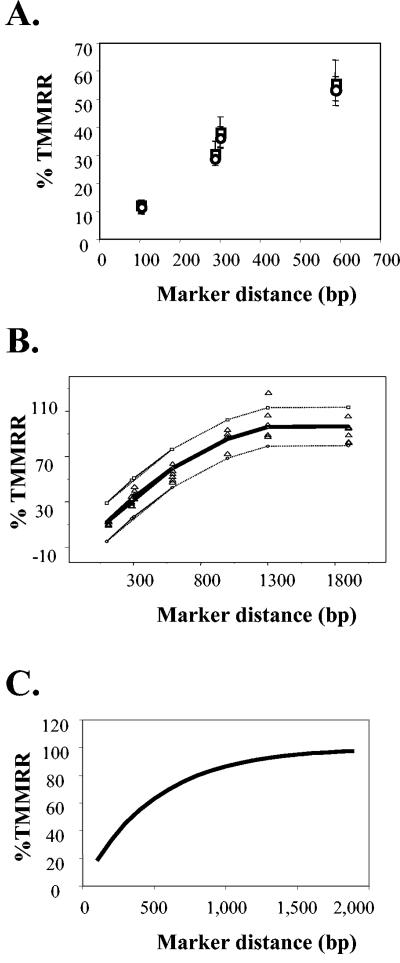
Recombination is a major mechanism that generates variation in populations of human immunodeficiency virus type 1 (HIV-1). Mutations that confer replication advantages, such as drug resistance, often cluster within regions of the HIV-1 genome. To explore how efficiently HIV-1 can assort markers separated by short distances, we developed a flow cytometry-based system to study recombination. Two HIV-1-based vectors were generated, one encoding the mouse heat-stable antigen gene and green fluorescent protein gene (GFP), and the other encoding the mouse Thy-1 gene and GFP. We generated derivatives of both vectors that contained nonfunctional GFP inactivated by different mutations. Recombination in the region between the two inactivating mutations during reverse transcription could yield a functional GFP. With this system, we determined that the recombination rates of markers separated by 588, 300, 288, and 103 bp in one round of viral replication are 56, 38, 31, and 12%, respectively, of the theoretical maximum measurable recombination rate. Statistical analyses revealed that at these intervals, recombination rates and marker distances have a near-linear relationship that is part of an overall quadratic fit. Additionally, we examined the segregation of three markers within 600 bp and concluded that HIV-1 crossover events do not exhibit high negative interference. We also examined the effects of target cells and viral accessory proteins on recombination rate. Similar recombination rates were observed when human primary CD4(+) T cells and a human T-cell line were used as target cells. We also found equivalent recombination rates in the presence and absence of accessory genes vif, vpr, vpu, and nef. These results illustrate the power of recombination in generating viral population variation and predict the rapid assortment of mutations in the HIV-1 genome in infected individuals.
Figures
Similar articles
-
Comparison of the genetic recombination rates of human immunodeficiency virus type 1 in macrophages and T cells.J Virol. 2005 Jul;79(14):9337-40. doi: 10.1128/JVI.79.14.9337-9340.2005. J Virol. 2005. PMID: 15994830 Free PMC article.
-
An inducible packaging cell system for safe, efficient lentiviral vector production in the absence of HIV-1 accessory proteins.Virology. 2001 Mar 30;282(1):77-86. doi: 10.1006/viro.2000.0787. Virology. 2001. PMID: 11259192
-
Evaluation of a multiple-cycle, recombinant virus, growth competition assay that uses flow cytometry to measure replication efficiency of human immunodeficiency virus type 1 in cell culture.J Clin Microbiol. 2006 Jun;44(6):1930-43. doi: 10.1128/JCM.02415-05. J Clin Microbiol. 2006. PMID: 16757582 Free PMC article.
-
Novel factors interfering with human immunodeficiency virus-type 1 replication in vivo and in vitro.Tissue Antigens. 2013 Feb;81(2):61-71. doi: 10.1111/tan.12047. Tissue Antigens. 2013. PMID: 23330719 Review.
-
HIV accessory proteins and surviving the host cell.Curr HIV/AIDS Rep. 2004 Apr;1(1):47-53. doi: 10.1007/s11904-004-0007-x. Curr HIV/AIDS Rep. 2004. PMID: 16091223 Review.
Cited by
-
Patterns of Human Immunodeficiency Virus type 1 recombination ex vivo provide evidence for coadaptation of distant sites, resulting in purifying selection for intersubtype recombinants during replication.J Virol. 2010 Aug;84(15):7651-61. doi: 10.1128/JVI.00276-10. Epub 2010 May 26. J Virol. 2010. PMID: 20504919 Free PMC article.
-
Translation of HIV-1 unspliced RNA is regulated by 5' untranslated region structure.J Virol. 2024 Oct 22;98(10):e0116024. doi: 10.1128/jvi.01160-24. Epub 2024 Sep 24. J Virol. 2024. PMID: 39315813 Free PMC article.
-
Comparison of the genetic recombination rates of human immunodeficiency virus type 1 in macrophages and T cells.J Virol. 2005 Jul;79(14):9337-40. doi: 10.1128/JVI.79.14.9337-9340.2005. J Virol. 2005. PMID: 15994830 Free PMC article.
-
Mechanisms of human immunodeficiency virus type 2 RNA packaging: efficient trans packaging and selection of RNA copackaging partners.J Virol. 2011 Aug;85(15):7603-12. doi: 10.1128/JVI.00562-11. Epub 2011 May 25. J Virol. 2011. PMID: 21613401 Free PMC article.
-
Capsid proteins from human immunodeficiency virus type 1 and simian immunodeficiency virus SIVmac can coassemble into mature cores of infectious viruses.J Virol. 2008 Sep;82(17):8253-61. doi: 10.1128/JVI.02663-07. Epub 2008 Jun 25. J Virol. 2008. PMID: 18579598 Free PMC article.
References
Publication types
MeSH terms
Substances
LinkOut - more resources
Full Text Sources
Research Materials
Miscellaneous
