

Functional analysis of a structural model of the ATP-binding site of the KATP channel Kir6.2 subunit
- PMID: 15650751
- PMCID: PMC545803
- DOI: 10.1038/sj.emboj.7600487
Functional analysis of a structural model of the ATP-binding site of the KATP channel Kir6.2 subunit
Abstract
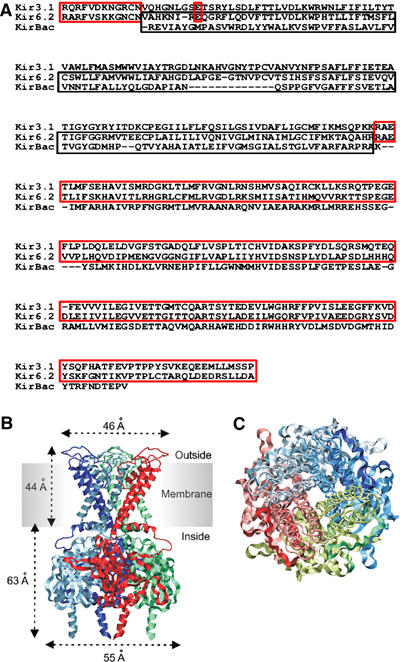
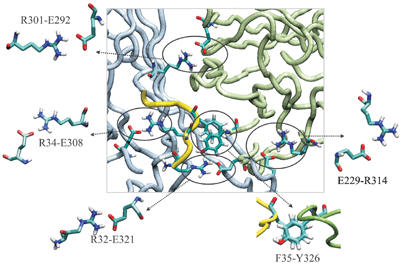
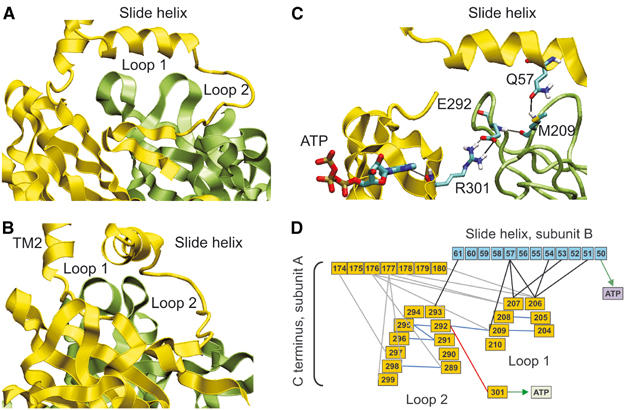
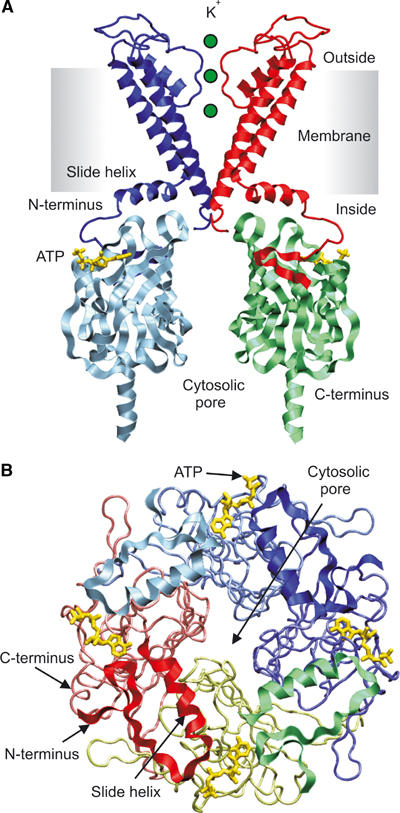
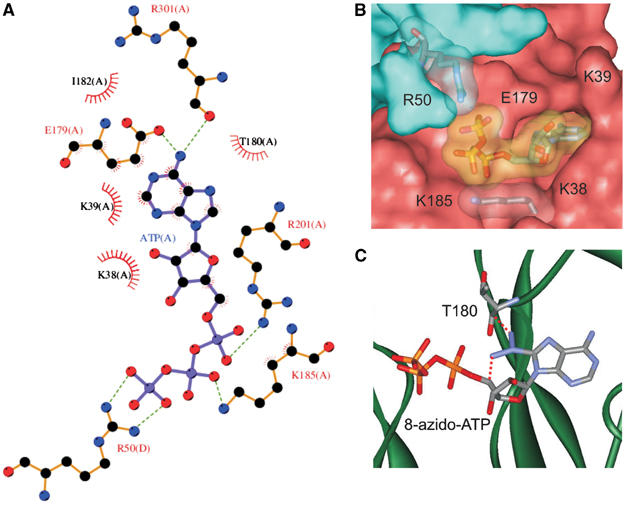
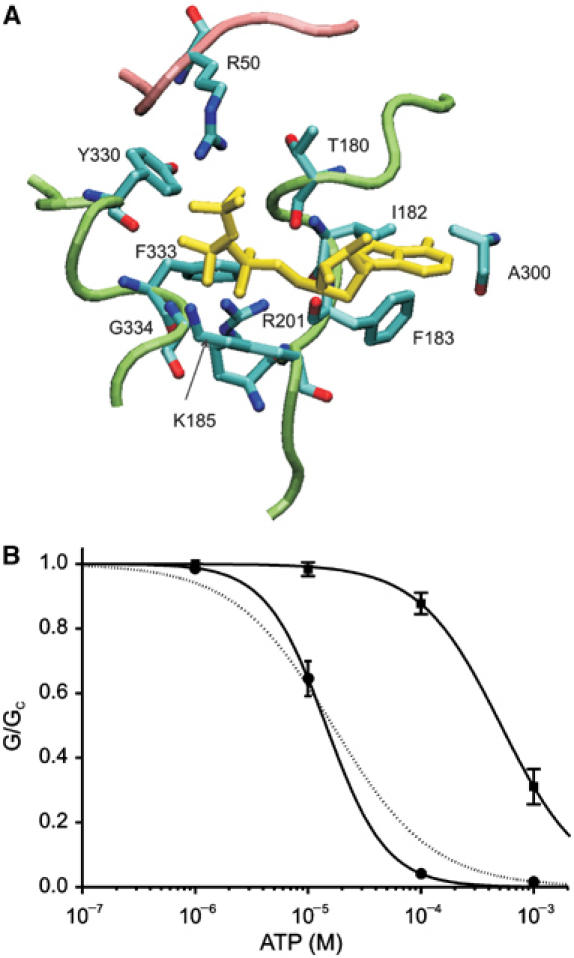
ATP-sensitive potassium (KATP) channels couple cell metabolism to electrical activity by regulating K+ flux across the plasma membrane. Channel closure is mediated by ATP, which binds to the pore-forming subunit (Kir6.2). Here we use homology modelling and ligand docking to construct a model of the Kir6.2 tetramer and identify the ATP-binding site. The model is consistent with a large amount of functional data and was further tested by mutagenesis. Ligand binding occurs at the interface between two subunits. The phosphate tail of ATP interacts with R201 and K185 in the C-terminus of one subunit, and with R50 in the N-terminus of another; the N6 atom of the adenine ring interacts with E179 and R301 in the same subunit. Mutation of residues lining the binding pocket reduced ATP-dependent channel inhibition. The model also suggests that interactions between the C-terminus of one subunit and the 'slide helix' of the adjacent subunit may be involved in ATP-dependent gating. Consistent with a role in gating, mutations in the slide helix bias the intrinsic channel conformation towards the open state.
Figures
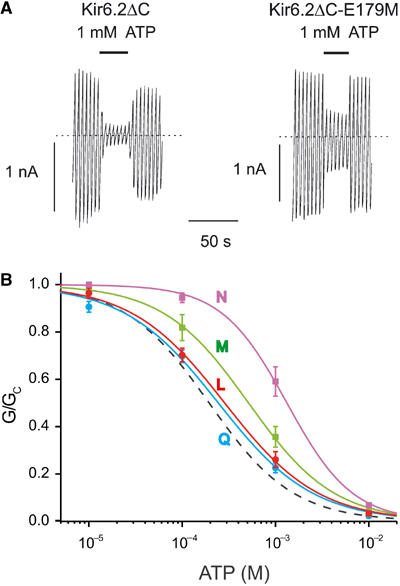
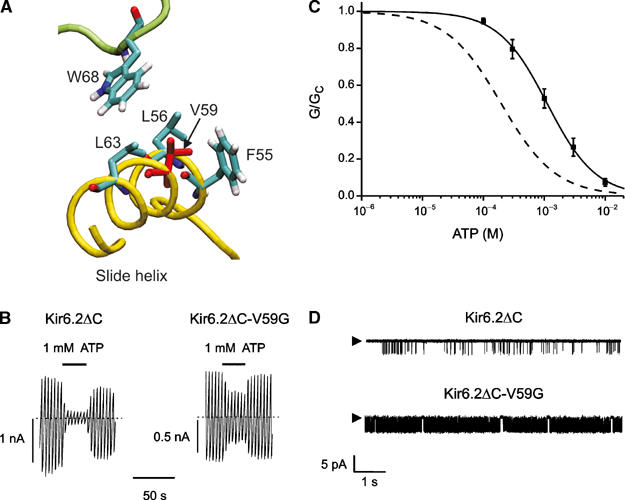
 , n=5), M (
 , n=5), L (
 , n=5) and Q (
 , n=7). The curves are the best fit to equation (1), using values for IC50 and h given in Table I. The dashed line indicates the wild-type data.
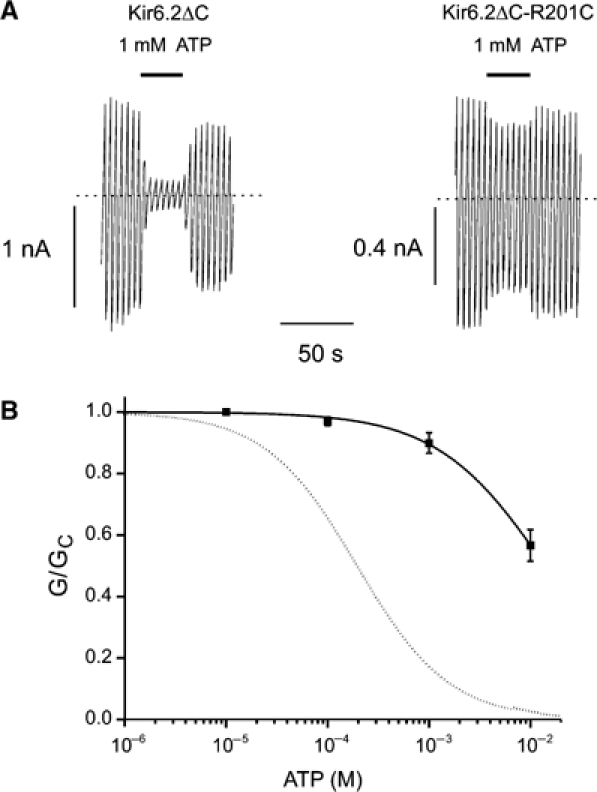
References
-
- Ämmälä C, Bokvist K, Galt S, Rorsman P (1991) Inhibition of ATP-regulated K+-channels by a photoactivatable ATP-analogue in mouse pancreatic beta-cells. Biochim Biophys Acta 1092: 347–349 - PubMed
-
- Brejc K, van Dijk WJ, Klaassen RV, Schuurmans M, van Der Oost J, Smit AB, Sixma TK (2001) Crystal structure of an ACh-binding protein reveals the ligand-binding domain of nicotinic receptors. Nature 411: 269–276 - PubMed
-
- Clement JP, Kunjilwar K, Gonzalez G, Schwanstecher M, Panten U, Aguilar Bryan L, Bryan J (1997) Association and stoichiometry of KATP channel subunits. Neuron 18: 827–838 - PubMed
Publication types
MeSH terms
Substances
Associated data
- Actions
LinkOut - more resources
Full Text Sources
Other Literature Sources
