

Explaining inconsistencies between data on condom use and condom sales
- PMID: 15651994
- PMCID: PMC545997
- DOI: 10.1186/1472-6963-5-5
Explaining inconsistencies between data on condom use and condom sales
Abstract
Background: Several HIV prevention programs use data on condom sales and survey-based data on condom prevalence to monitor progress. However, such indicators are not always consistent. This paper aims to explain these inconsistencies and to assess whether the number of sex acts and the number of condoms used can be estimated from survey data. This would be useful for program managers, as it would enable estimation of the number of condoms needed for different target groups.
Methods: We use data from six Demographic and Health Surveys to estimate the total annual number of sex acts and number of condoms used. Estimates of the number of sex acts are based on self-reported coital frequency, the proportion reporting intercourse the previous day, and survival methods. Estimates of the number of condoms used are based on self-reported frequency of use, the proportion reporting condom use the previous day and in last intercourse. The estimated number of condoms used is then compared with reported data on condom sales and distribution.
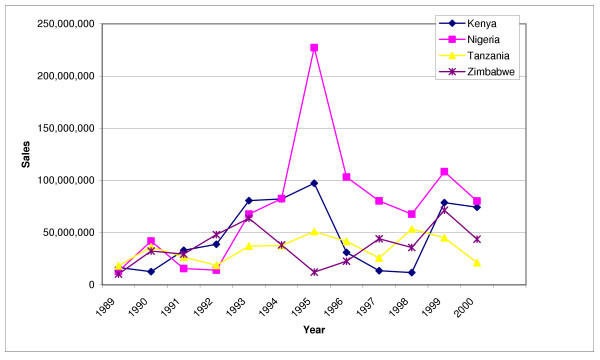
Results: Analysis of data on the annual number of condoms sold and distributed to the trade reveals very erratic patterns, which reflect stock-ups at various levels in the distribution chain. Consequently, condom sales data are a very poor indicator of the level of condom use. Estimates of both the number of sexual acts and the number of condoms used vary enormously based on the estimation method used. For several surveys, the highest estimate of the annual number of condoms used is tenfold that of the lowest estimate.
Conclusions: Condom sales to the trade are a poor indicator of levels of condom use, and are therefore insufficient to monitor HIV prevention programs. While survey data on condom prevalence allow more detailed monitoring, converting such data to an estimated number of sex acts and condoms used is not straightforward. The estimation methods yield widely different results, and it is impossible to determine which method is most accurate. Until the reliability of these various estimation methods can be established, estimating the annual number of condoms used from survey data will not be feasible. Collecting survey data on the number of sex acts and the number of condoms used in a fixed time period may enable the calculation of more reliable estimates of the number of sex acts and condoms used.
Figures
Similar articles
-
A rapid situation and response assessment of the female regular sex partners of male drug users in South Asia: factors associated with condom use during the last sexual intercourse.Int J Drug Policy. 2008 Apr;19(2):148-58. doi: 10.1016/j.drugpo.2007.12.003. Epub 2008 Jan 24. Int J Drug Policy. 2008. PMID: 18221862
-
Patterns of condom use in urban males in Zimbabwe: evidence from 4600 sexual contacts.AIDS Care. 2003 Jun;15(3):291-301. doi: 10.1080/0954012031000105351. AIDS Care. 2003. PMID: 12745397
-
Sexual behaviour and condom use among unmarried young men in Cambodia.AIDS Care. 2006 Jul;18(5):505-13. doi: 10.1080/13548500500221537. AIDS Care. 2006. PMID: 16777644
-
Condom use as a dependent variable: measurement issues relevant to HIV prevention programs.AIDS Educ Prev. 1998 Dec;10(6):548-57. AIDS Educ Prev. 1998. PMID: 9883289 Review.
-
The effectiveness of condoms in reducing heterosexual transmission of HIV.Fam Plann Perspect. 1999 Nov-Dec;31(6):272-9. Fam Plann Perspect. 1999. PMID: 10614517 Review.
Cited by
-
Scale-up and coverage of Avahan: a large-scale HIV-prevention programme among female sex workers and men who have sex with men in four Indian states.Sex Transm Infect. 2010 Feb;86 Suppl 1(Suppl_1):i76-82. doi: 10.1136/sti.2009.039115. Sex Transm Infect. 2010. PMID: 20167737 Free PMC article.
-
Modeling health impact of global health programs implemented by Population Services International.BMC Public Health. 2013;13 Suppl 2(Suppl 2):S3. doi: 10.1186/1471-2458-13-S2-S3. Epub 2013 Jun 17. BMC Public Health. 2013. PMID: 23902668 Free PMC article.
-
Condom Social Marketing Effects in Low- and Middle-Income Countries: A Systematic Review Update, 1990 to 2019.Am J Health Promot. 2020 Jan;34(1):91-95. doi: 10.1177/0890117119864921. Epub 2019 Jul 23. Am J Health Promot. 2020. PMID: 31337242 Free PMC article.
-
Estimating Contraceptive Prevalence Using Logistics Data for Short-Acting Methods: Analysis Across 30 Countries.Glob Health Sci Pract. 2015 Sep 15;3(3):462-81. doi: 10.9745/GHSP-D-15-00116. Print 2015 Sep. Glob Health Sci Pract. 2015. PMID: 26374805 Free PMC article.
-
Effects of condom social marketing on condom use in developing countries: a systematic review and meta-analysis, 1990-2010.Bull World Health Organ. 2012 Aug 1;90(8):613-622A. doi: 10.2471/BLT.11.094268. Epub 2012 May 29. Bull World Health Organ. 2012. PMID: 22893745 Free PMC article.
References
-
- United Nations General Assembly Special Session on HIV/AIDS Monitoring the Declaration of Committment on HIV/AIDS: Guidelines on Construction of Core Indicators. Geneva: Joint United Nations Programme on HIV/AIDS (UNAIDS) 2002.
-
- UNAIDS National AIDS Programmes: A Guide to Monitoring and Evaluation. Geneva: Joint United Nations Programme on AIDS (UNAIDS) 2000.
-
- Demographic and Health Surveys Model "B" Questionnaire. With Commentary for Low Contraceptive Prevalence Countries. Calverton, MD: Demographic and Health Surveys, Macro International, Inc. 1995.
-
- Centers for Disease Control and Prevention International Reproductive Health Surveys. [Web Page] 2004. http://www.cdc.gov/reproductivehealth/logistics/global_rhs.htm
-
- Boerma T. Reconciling Condom Distribution/Sales and Condom Use Figures. Preliminary Results from Tanzania. Chapel Hill, NC: Carolina Population Center, University of North Carolina; sd.
Publication types
MeSH terms
LinkOut - more resources
Full Text Sources
