

Charge recombination and thermoluminescence in photosystem II
- PMID: 15653722
- PMCID: PMC1305247
- DOI: 10.1529/biophysj.104.050237
Charge recombination and thermoluminescence in photosystem II
Abstract
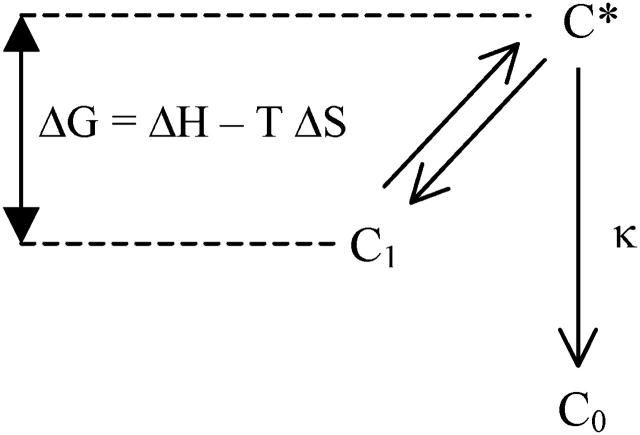
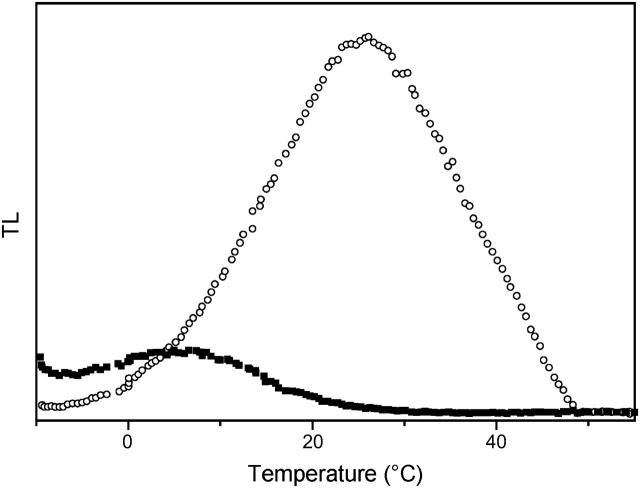
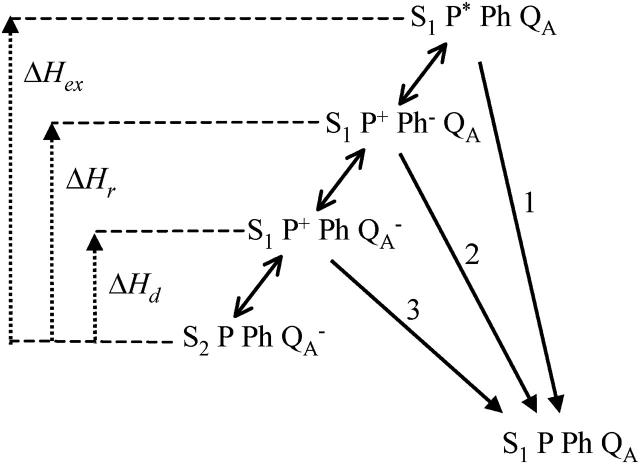
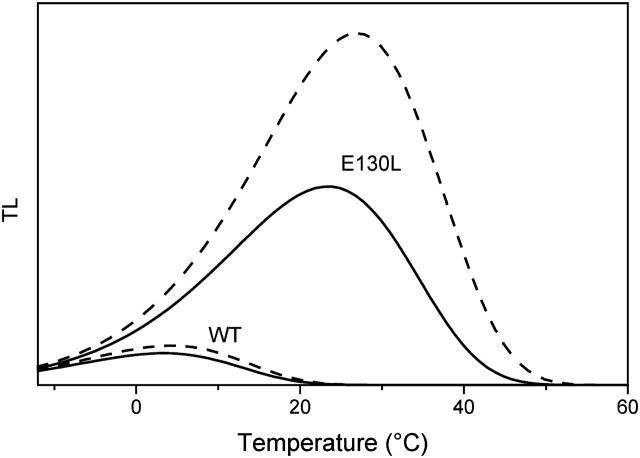
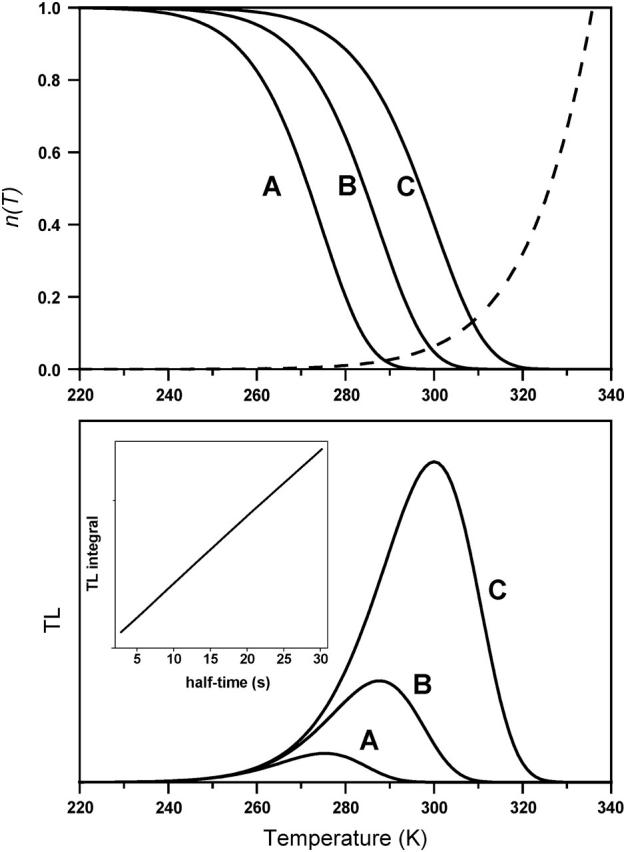
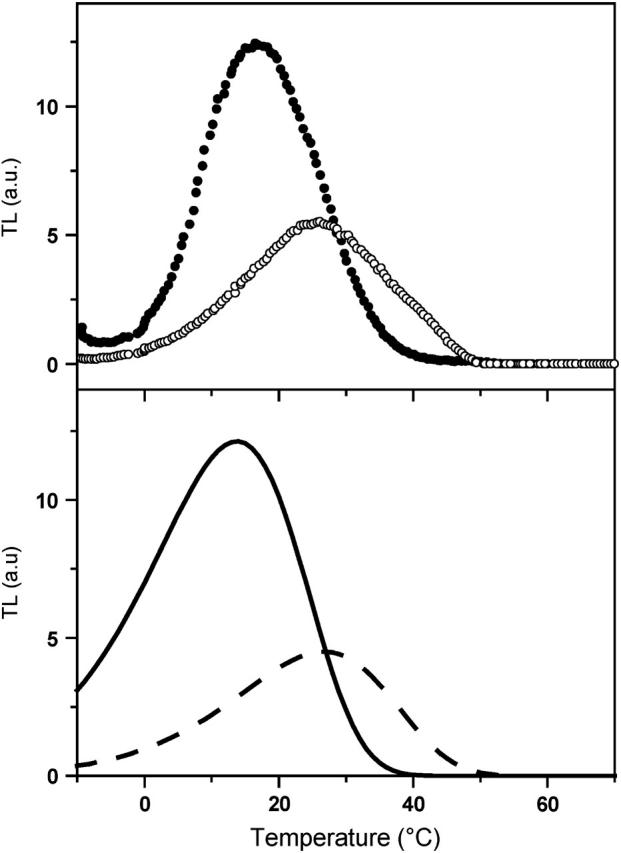
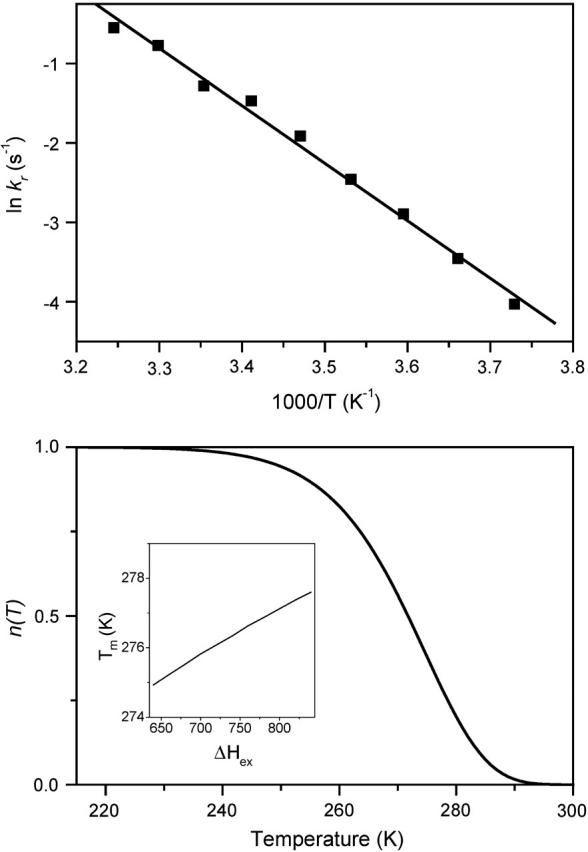
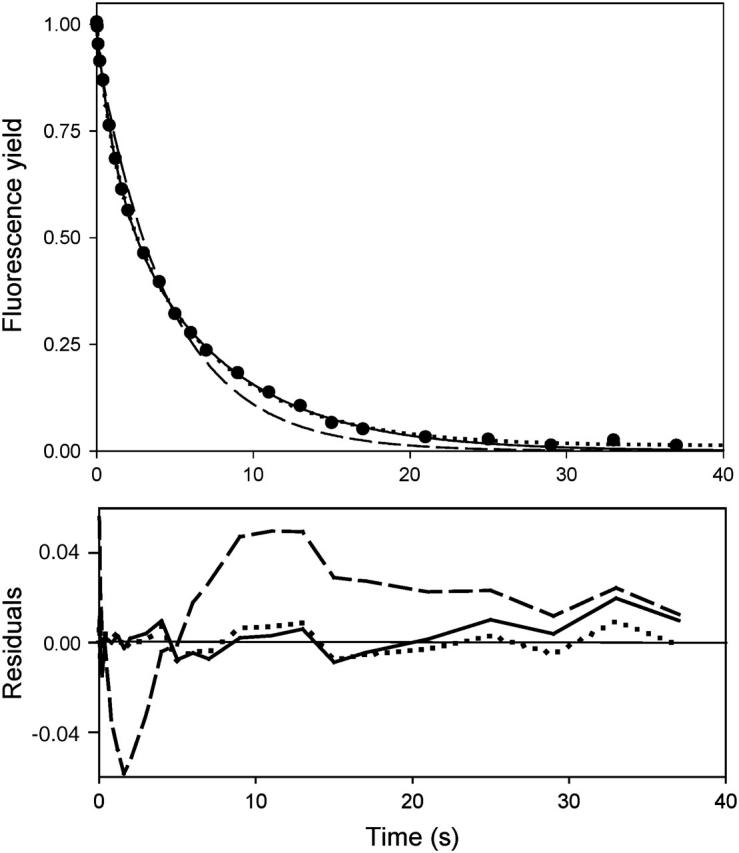
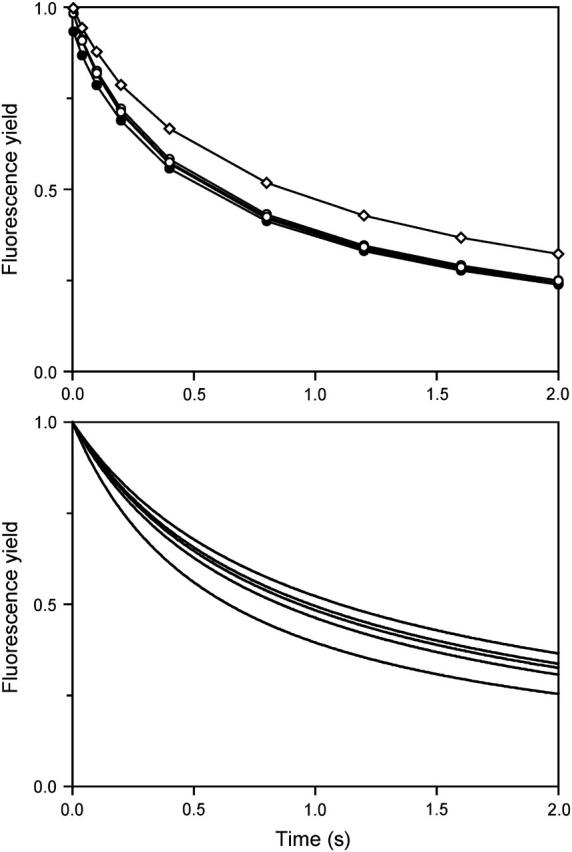
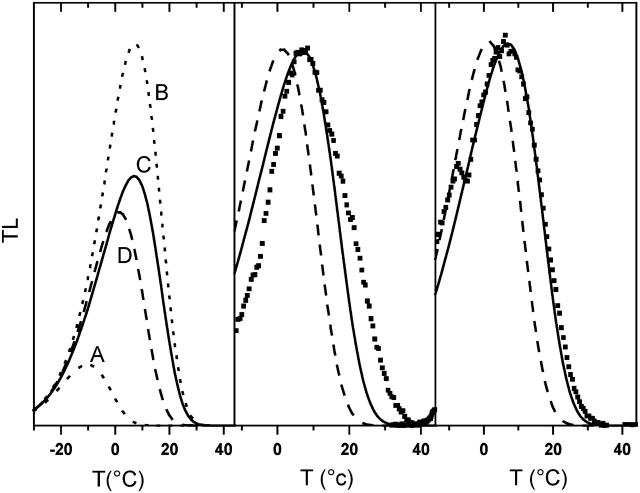
In the recombination process of Photosystem II (S(2)Q(A)(-)-->S(1)Q(A)) the limiting step is the electron transfer from the reduced primary acceptor pheophytin Ph(-) to the oxidized primary donor P(+) and the rate depends on the equilibrium constant between states S(2)PPhQ(A)(-) and S(1)P(+)Ph(-)Q(A). Accordingly, mutations that affect the midpoint potential of Ph or of P result in a modified recombination rate. A strong correlation is observed between the effects on the recombination rate and on thermoluminescence (TL, the light emission from S(2)Q(A)(-) during a warming ramp): a slower recombination corresponds to a large enhancement and higher temperature of the TL peak. The current theory of TL does not account for these effects, because it is based on the assumption that the rate-limiting step coincides with the radiative process. When implementing the known fact that the radiative pathway represents a minor leak, the modified TL theory readily accounts qualitatively for the observed behavior. However, the peak temperature is still lower than predicted from the temperature-dependence of recombination. We argue that this reflects the heterogeneity of the recombination process combined with the enhanced sensitivity of TL to slower components. The recombination kinetics are accurately fitted as a sum of two exponentials and we show that this is not due to a progressive stabilization of the charge-separated state, but to a pre-existing conformational heterogeneity.
Figures
Similar articles
-
Radiative and non-radiative charge recombination pathways in Photosystem II studied by thermoluminescence and chlorophyll fluorescence in the cyanobacterium Synechocystis 6803.Biochim Biophys Acta. 2007 Mar;1767(3):233-43. doi: 10.1016/j.bbabio.2007.01.022. Epub 2007 Feb 7. Biochim Biophys Acta. 2007. PMID: 17349965
-
Acetate in mixotrophic growth medium affects photosystem II in Chlamydomonas reinhardtii and protects against photoinhibition.Biochim Biophys Acta. 2013 Oct;1827(10):1183-90. doi: 10.1016/j.bbabio.2013.06.004. Epub 2013 Jun 17. Biochim Biophys Acta. 2013. PMID: 23791666
-
Modulating the redox potential of the stable electron acceptor, Q(B), in mutagenized photosystem II reaction centers.Biochemistry. 2011 Mar 8;50(9):1454-64. doi: 10.1021/bi1017649. Epub 2011 Feb 10. Biochemistry. 2011. PMID: 21235277
-
Thermoluminescence in photosynthesis. 4. Influence of energy transfer processes.Membr Cell Biol. 1997;11(4):431-40. Membr Cell Biol. 1997. PMID: 9553931 Review.
-
Thermoluminescence: theory.Photosynth Res. 2009 Aug-Sep;101(2-3):205-16. doi: 10.1007/s11120-009-9437-z. Epub 2009 Jun 17. Photosynth Res. 2009. PMID: 19533412 Review.
Cited by
-
D1-arginine257 mutants (R257E, K, and Q) of Chlamydomonas reinhardtii have a lowered QB redox potential: analysis of thermoluminescence and fluorescence measurements.Photosynth Res. 2008 Oct-Dec;98(1-3):449-68. doi: 10.1007/s11120-008-9351-9. Epub 2008 Sep 6. Photosynth Res. 2008. PMID: 18777103 Free PMC article.
-
Chlorophyll thermofluorescence and thermoluminescence as complementary tools for the study of temperature stress in plants.Photosynth Res. 2007 Jul-Sep;93(1-3):159-71. doi: 10.1007/s11120-007-9132-x. Epub 2007 Feb 6. Photosynth Res. 2007. PMID: 17279439 Review.
-
Singlet oxygen production in photosystem II and related protection mechanism.Photosynth Res. 2008 Oct-Dec;98(1-3):551-64. doi: 10.1007/s11120-008-9349-3. Epub 2008 Sep 9. Photosynth Res. 2008. PMID: 18780159 Review.
-
PS II model-based simulations of single turnover flash-induced transients of fluorescence yield monitored within the time domain of 100 ns-10 s on dark-adapted Chlorella pyrenoidosa cells.Photosynth Res. 2008 Oct-Dec;98(1-3):105-19. doi: 10.1007/s11120-008-9374-2. Epub 2008 Oct 21. Photosynth Res. 2008. PMID: 18937044
-
Thermoluminescence and conformational transitions in the primary processes of photosynthesis.Dokl Biochem Biophys. 2012 May-Jun;444:149-53. doi: 10.1134/S1607672912030076. Epub 2012 Jul 8. Dokl Biochem Biophys. 2012. PMID: 22772998 No abstract available.
References
-
- Arata, H., and W. W. Parson. 1981. Delayed fluorescence from Rhodopseudomonas sphaeroides reactions centers. Enthalpy and free energy changes accompanying electron transfer from P-870 to quinones. Biochim. Biophys. Acta. 638:201–209. - PubMed
-
- Bennoun, P. 1970. Reoxidation of the fluorescence quencher “Q” in the presence of 3-(3,4-dichlorophenyl)-1,1-dimethylurea. Biochim. Biophys. Acta. 216:357–363. - PubMed
-
- Bennoun, P. 1983. Effects of mutations and of ionophore on chlororespiration in Chlamydomonas reinhardtii. FEBS Lett. 156:363–365.
-
- Cuni, A., L. Xiong, R. T. Sayre, F. Rappaport, and J. Lavergne. 2004. Modification of the pheophytin midpoint potential in Photosystem II: modulation of the quantum yield of charge separation and of charge recombination pathways. Phys. Chem. Chem. Phys. 6:4825–4831.
-
- De Grooth, B. G., and H. J. van Gorkom. 1981. External electric field effects on prompt and delayed fluorescence in chloroplasts. Biochim. Biophys. Acta. 635:445–456. - PubMed
Publication types
MeSH terms
Substances
LinkOut - more resources
Full Text Sources
