. 2005 Mar;88(3):2299-308.
doi: 10.1529/biophysj.104.051706. Epub 2005 Jan 14.

Nano- to microscale dynamics of P-selectin detachment from leukocyte interfaces. II. Tether flow terminated by P-selectin dissociation from PSGL-1

Affiliations

Nano- to microscale dynamics of P-selectin detachment from leukocyte interfaces. II. Tether flow terminated by P-selectin dissociation from PSGL-1

Volkmar Heinrich et al. Biophys J. 2005 Mar.

Abstract

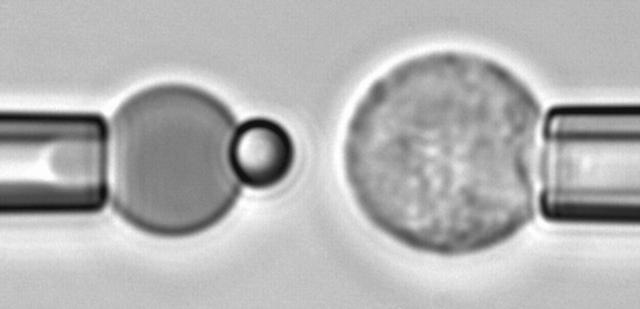
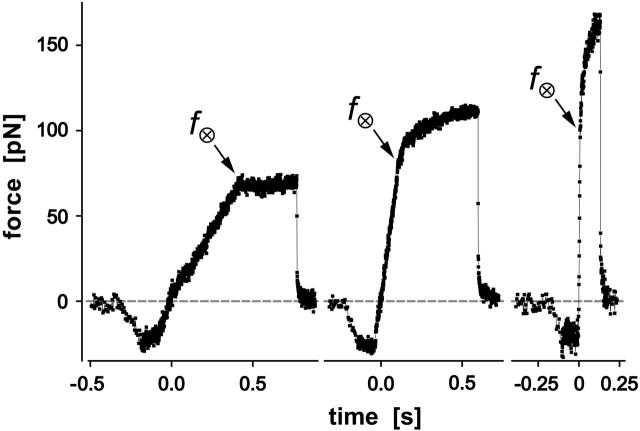
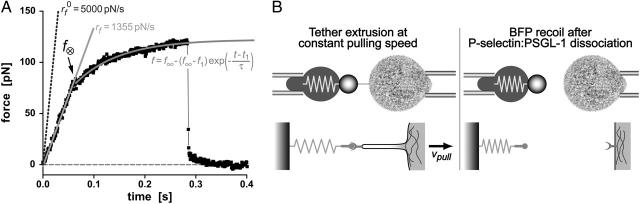
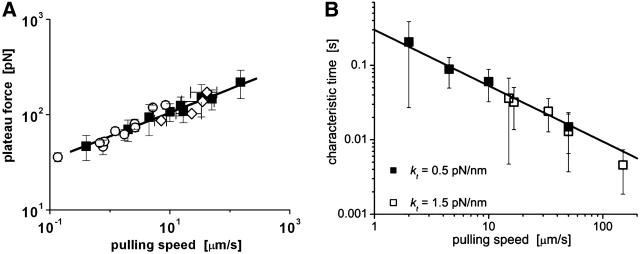
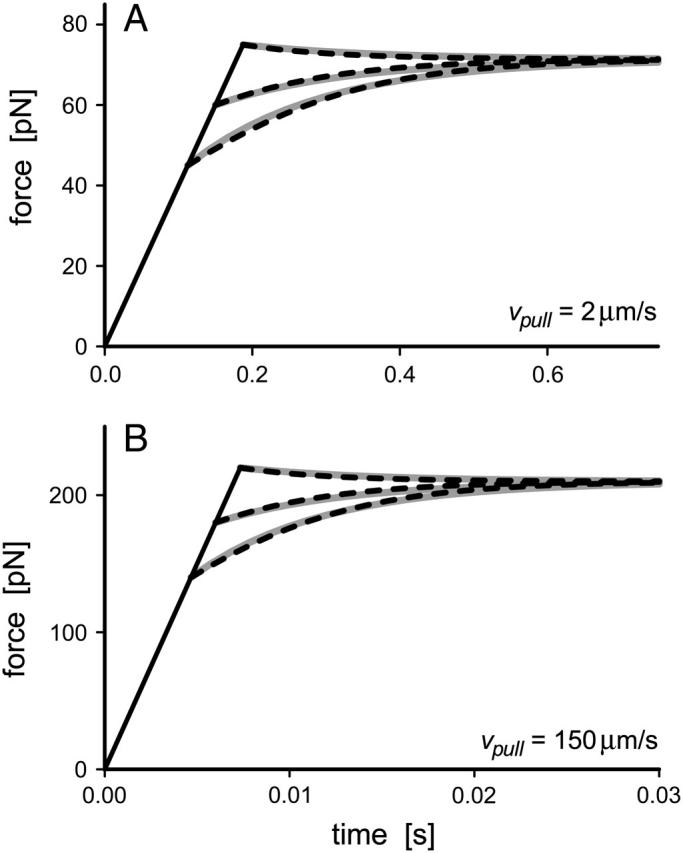
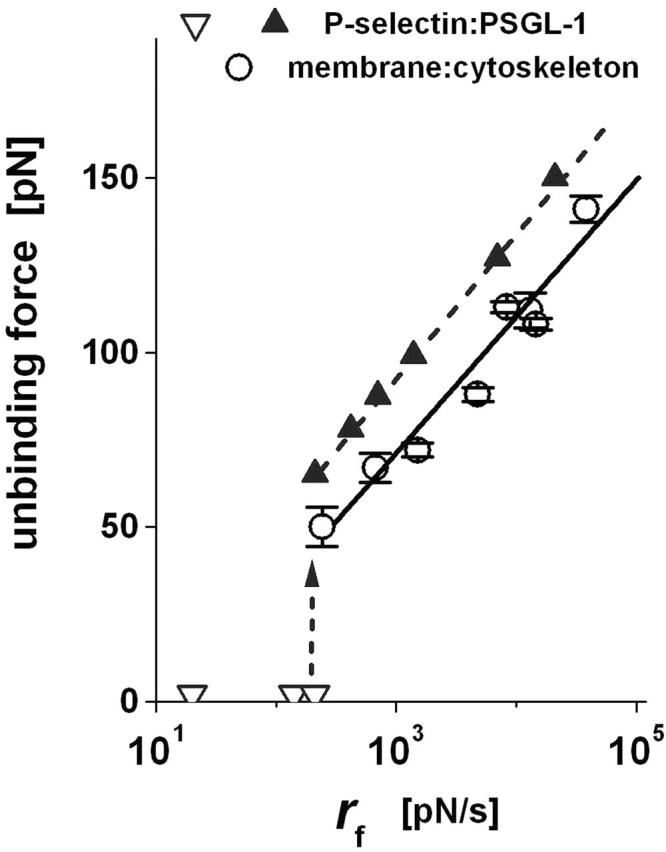
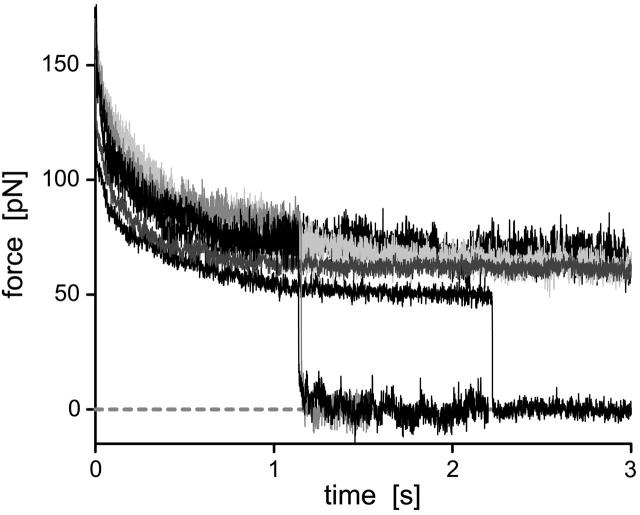
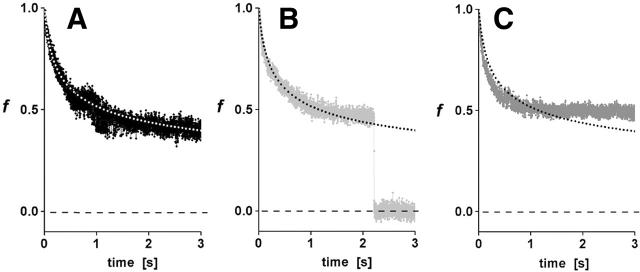
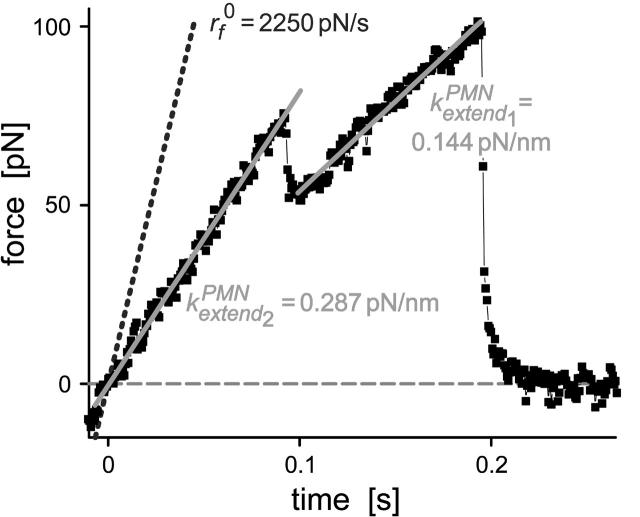
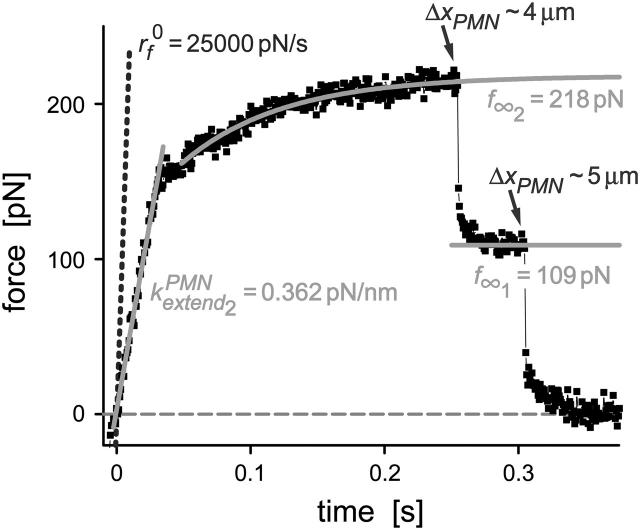
We have used a biomembrane force probe decorated with P-selectin to form point attachments with PSGL-1 receptors on a human neutrophil (PMN) in a calcium-containing medium and then to quantify the forces experienced by the attachment during retraction of the PMN at fixed speed. From first touch to final detachment, the typical force history exhibited the following sequence of events: i), an initial linear-elastic displacement of the PMN surface, ii), an abrupt crossover to viscoplastic flow that signaled membrane separation from the interior cytoskeleton and the beginning of a membrane tether, and iii), the final detachment from the probe tip most often by one precipitous step of P-selectin:PSGL-1 dissociation. Analyzing the initial elastic response and membrane unbinding from the cytoskeleton in our companion article I, we focus in this article on the regime of tether extrusion that nearly always occurred before release of the extracellular adhesion bond at pulling speeds > or =1 microm/s. The force during tether growth appeared to approach a plateau at long times. Examined over a large range of pulling speeds up to 150 microm/s, the plateau force exhibited a significant shear thinning as indicated by a weak power-law dependence on pulling speed, f(infinity) = 60 pN(nu(pull)/microm/s)(0.25). Using this shear-thinning response to describe the viscous element in a nonlinear Maxwell-like fluid model, we show that a weak serial-elastic component with a stiffness of approximately 0.07 pN/nm provides good agreement with the time course of the tether force approach to the plateau under constant pulling speed.


Figures

FIGURE 1
FIGURE 1
Video micrograph of a biomembrane force probe (left) and a PMN target held in an opposing micropipette (right). The exposed spherical segment of the BFP red cell has a diameter of ∼6 μm.
FIGURE 2
FIGURE 2
Examples of BFP force-time curves obtained for P-selectin:PMN attachments at three different pulling speeds (vpull ∼ 2, 15, 50 μm/s). Negative forces represent the initial indentation of the PMN at touch regulated by feedback control. Labeled by the force f, termination of the initial elastic regime marked the onset of the tether flow regime. The final precipitous drop in force revealed the BFP recoil upon release of the PMN tether by P-selectin dissociation from PSGL-1. (The data shown here and in the following figures were obtained at 1500/s framing rate without averaging.)
FIGURE 3
FIGURE 3
(A) Functional relations and parameters used to model the two regimes of force response observed under constant speed retraction of a PMN from attachment to a P-selectin probe tip. Beginning with an initial elastic-like regime, the PMN attachment force closely follows the solid straight line with a significantly diminished slope (loading rate) relative to the nominal loading rate defined by the BFP spring constant times the pulling speed (dotted line). The reduction in slope is due to the soft response of the PMN cortex. The crossover force f marks the event of membrane separation from the cytoskeleton and the onset of viscous tether growth. The force driving tether flow appears to follow an exponential-like transient in time approaching a plateau in force f (curved solid line). (B) Schematic of tether extrusion and BFP recoil at final detachment. The spring overlay symbolizes the Hookean elastic response of the BFP red cell at small axial deformations. The schematic below shows the corresponding microscale deformation of the PMN structure. The complementary pin and Y-shaped symbols represent the specific P-selectin and PSGL-1 interaction.
FIGURE 4
FIGURE 4
(A) The plateau forces f (solid squares) obtained from fits to each tethering regime are plotted as functions of PMN retraction speed on a log-log scale. The solid line is a power law fit to the BFP data defined by, f ≈ 60pN (vpull/μm/s)0.25. Open circles are data replotted from Shao and Hochmuth (1996). Open diamonds are data measured previously by Schmidtke and Diamond (2000). (B) Log-log plot of the apparent relaxation times for approach to a plateau in tethering force as function of the tether-pulling speed. The solid line is an inverse power law fit to the BFP data defined by, τ ≈ 0.3 s (μm/s / vpull)0.75. (Error bars denote standard deviations.)
FIGURE 5
FIGURE 5
Comparison of the numerical solutions for the nonlinear Maxwell model (Eq. 6; dashed curves) to the exponential approximations (Eq. 3; gray solid curves) used to fit tether-force transients at constant pulling speeds of 2 μm/s in panel A and 150 μm/s in panel B.
FIGURE 6
FIGURE 6
Histograms of tether growth times for two fast pulling speeds. The solid curves are exponentials that best match the data. The time constants listed on each figure are consistent with the dissociation of a monomeric P-selectin bond to PSGL-1 when held at the most frequent force found for membrane separation from the cytoskeleton. (The shaded bins represent the range of observations obscured by nonspecific forces arising from hydrodynamic coupling between the probe tip and the cell surface at fast pulling speeds, discussed in the Materials and Methods section of article I.)
FIGURE 7
FIGURE 7
The mean values measured for the lifetimes of all attachments are plotted as a function of the initial elastic loading rates produced by retraction of the PMNs at pulling speeds >1 μm/s. The solid curve shows the attachment lifetime expected for an uncorrelated dimeric P-selectin connection to PSGL-1. (Error bars denote means ± SE.)
FIGURE 8
FIGURE 8
The most frequent forces for breaking P-selectin:PSGL-1 bonds measured in tests with the molecules immobilized on glass beads (solid triangles; data taken from Evans et al., 2004) are compared to the most frequent forces for membrane unbinding from the PMN cytoskeleton as described in article I (open circles; Evans et al., 2005). The parallel hierarchy of these failure events at fast loading rates accounts for the correlation between the onset of tether formation and subsequent termination by P-selectin dissociation. (Error bars denote means ± SE, which lie within the data symbols for the bead-bead tests.)
FIGURE 9
FIGURE 9
Examples of force relaxation for six tethers held at constant lengths. The long survival of these tethers at high forces implies that the attachments were sustained by many P-selectin bonds.
FIGURE 10
FIGURE 10
As representative examples from the data in Fig. 9, three force relaxations at constant length are plotted on a normalized scale and compared with the prediction in Eq. 7 (dotted curves) based on the nonlinear Maxwell model. Although the model predicts that the tether force should go to zero at zero pulling speed, some other process appears to take over and arrest flow at long times. Still, the simple model is able to capture the force relaxation at constant length over a very large time frame (≥1 s), equivalent to 100-fold decrease in the internal viscous flow implied by the model.
FIGURE A1
FIGURE A1
Example of a parallel elastic deformation of the PMN surface that appears to arise from pulling at separate sites of attachment. The linear fits (solid lines) to the hierarchy of elastic regimes start at the origin, indicating that the deformation fields local to each bond were independent. In this case, the two elastic regimes are found to differ by a factor of two in stiffness. The nominal loading ramp formula image was set by a BFP spring constant of 0.5 pN/nm and pulling speed of 4.5 μm/s (dotted line).
FIGURE A2
FIGURE A2
Example of a sequential detachment of two parallel tethers pulled from a PMN surface. The force levels appear to be quantized values of the average plateau force (<f> ≈ 108.5 pN) expected for pulling a single tether at this speed (16.7 μm/s). The tether length immediately before each failure is noted on the figure. The nominal loading ramp formula image was set by a BFP spring constant of 1.5 pN/nm and the pulling speed (dotted line).

Similar articles

Cited by

References

    1. Alon, R., S. Chen, K. D. Puri, E. B. Finger, and T. A. Springer. 1997. The kinetics of L-selectin tethers and the mechanics of selectin-mediated rolling. J. Cell Biol. 138:1169–1180. - PMC - PubMed
    1. Alon, R., D. A. Hammer, and T. A. Springer. 1995. Lifetime of the P-selectin-carbohydrate bond and its response to tensile force in hydrodynamic flow. Nature. 374:539–542. - PubMed
    1. Bell, G. I. 1978. Models for the specific adhesion of cells to cells. Science. 200:618–627. - PubMed
    1. Božič, B., S. Svetina, B. Žekš, and R. E. Waugh. 1992. The role of lamellar membrane structure in tether formation from bilayer vesicles. Biophys. J. 61:963–973. - PMC - PubMed
    1. Brunk, D. K., and D. A. Hammer. 1997. Quantifying rolling adhesion with a cell-free assay: E-selectin and its carbohydrate ligands. Biophys. J. 72:2820–2833. - PMC - PubMed

Publication types