

A vibrational spectral maker for probing the hydrogen-bonding status of protonated Asp and Glu residues
- PMID: 15653739
- PMCID: PMC1305378
- DOI: 10.1529/biophysj.104.047639
A vibrational spectral maker for probing the hydrogen-bonding status of protonated Asp and Glu residues
Abstract
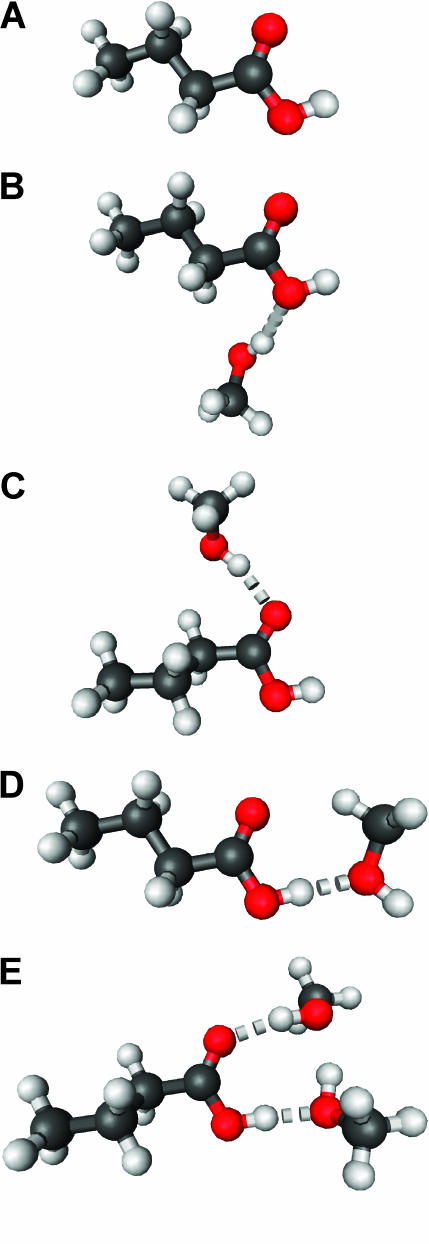
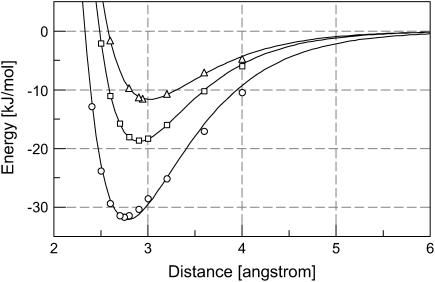
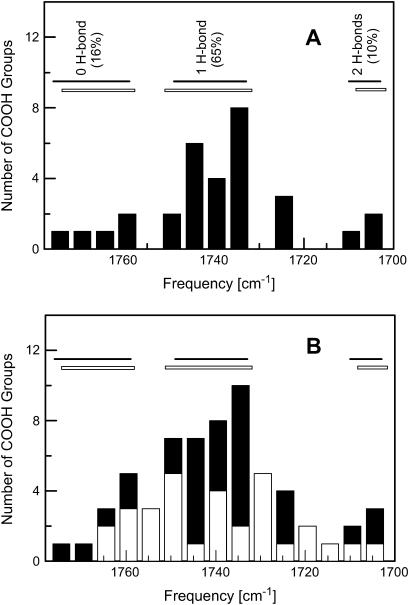
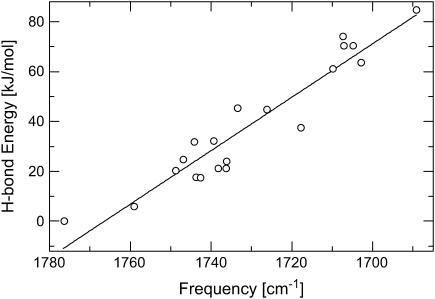
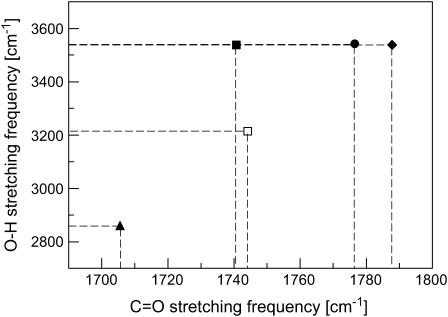
Hydrogen bonding is a fundamental element in protein structure and function. Breaking a single hydrogen bond may impair the stability of a protein. We report an infrared vibrational spectral marker for probing the hydrogen-bond number for buried, protonated Asp or Glu residues in proteins. Ab initio computational studies were performed on hydrogen-bonding interactions of a COOH group with a variety of side-chain model compounds of polar and charged amino acids in vacuum using density function theory. For hydrogen-bonding interactions with polar side-chain groups, our results show a strong correlation between the C=O stretching frequency and the hydrogen bond number of a COOH group: approximately 1759-1776 cm(-1) for zero, approximately 1733-1749 cm(-1) for one, and 1703-1710 cm(-1) for two hydrogen bonds. Experimental evidence for this correlation will be discussed. In addition, we show an approximate linear correlation between the C=O stretching frequency and the hydrogen-bond strength. We propose that a two-dimensional infrared spectroscopy, C=O stretching versus O-H stretching, may be employed to identify the specific type of hydrogen-bonding interaction. This vibrational spectral marker for hydrogen-bonding interaction is expected to enhance the power of time-resolved Fourier transform infrared spectroscopy for structural characterization of functionally important intermediates of proteins.
Figures
Similar articles
-
Structures of aspartic acid-96 in the L and N intermediates of bacteriorhodopsin: analysis by Fourier transform infrared spectroscopy.Biochemistry. 1992 May 19;31(19):4684-90. doi: 10.1021/bi00134a022. Biochemistry. 1992. PMID: 1316157
-
Electrostatic influence of QA reduction on the IR vibrational mode of the 10a-ester C==O of HA demonstrated by mutations at residues Glu L104 and Trp L100 in reaction centers from Rhodobacter sphaeroides.Biochemistry. 1997 Apr 15;36(15):4515-25. doi: 10.1021/bi962871k. Biochemistry. 1997. PMID: 9109660
-
Strong hydrogen bond between glutamic acid 46 and chromophore leads to the intermediate spectral form and excited state proton transfer in the Y42F mutant of the photoreceptor photoactive yellow protein.Biochemistry. 2009 Oct 27;48(42):9980-93. doi: 10.1021/bi9012897. Biochemistry. 2009. PMID: 19764818
-
Two-dimensional infrared spectroscopy of intermolecular hydrogen bonds in the condensed phase.Acc Chem Res. 2009 Sep 15;42(9):1220-8. doi: 10.1021/ar900006u. Acc Chem Res. 2009. PMID: 19425543 Review.
-
Coupling of electron transfer to proton uptake at the Q(B) site of the bacterial reaction center: a perspective from FTIR difference spectroscopy.Biochim Biophys Acta. 2008 Oct;1777(10):1229-48. doi: 10.1016/j.bbabio.2008.06.012. Epub 2008 Jul 11. Biochim Biophys Acta. 2008. PMID: 18671937 Review.
Cited by
-
His-75 in proteorhodopsin, a novel component in light-driven proton translocation by primary pumps.J Biol Chem. 2009 Jan 30;284(5):2836-2843. doi: 10.1074/jbc.M803792200. Epub 2008 Nov 17. J Biol Chem. 2009. PMID: 19015272 Free PMC article.
-
Light-driven Na(+) pump from Gillisia limnaea: a high-affinity Na(+) binding site is formed transiently in the photocycle.Biochemistry. 2014 Dec 9;53(48):7549-61. doi: 10.1021/bi501064n. Epub 2014 Nov 24. Biochemistry. 2014. PMID: 25375769 Free PMC article.
-
Long-term hydrolytic degradation study of polycaprolactone films and fibers grafted with poly(sodium styrene sulfonate): Mechanism study and cell response.Biointerphases. 2020 Nov 17;15(6):061006. doi: 10.1116/6.0000429. Biointerphases. 2020. PMID: 33203213 Free PMC article.
-
Evidence from FTIR difference spectroscopy of an extensive network of hydrogen bonds near the oxygen-evolving Mn(4)Ca cluster of photosystem II involving D1-Glu65, D2-Glu312, and D1-Glu329.Biochemistry. 2010 Aug 10;49(31):6655-69. doi: 10.1021/bi100730d. Biochemistry. 2010. PMID: 20593803 Free PMC article.
-
Transient protonation changes in channelrhodopsin-2 and their relevance to channel gating.Proc Natl Acad Sci U S A. 2013 Apr 2;110(14):E1273-81. doi: 10.1073/pnas.1219502110. Epub 2013 Mar 18. Proc Natl Acad Sci U S A. 2013. PMID: 23509282 Free PMC article.
References
-
- Acharya, S., and S. S. Karnik. 1996. Modulation of GDP release from transducin by the conserved Glu134-Arg135 sequence in rhodopsin. J. Biol. Chem. 271:25406–25411. - PubMed
-
- Arnis, S., K. Fahmy, K. P. Hofmann, and T. P. Sakmar. 1994. A conserved carboxylic acid group mediates light-dependent proton uptake and signaling by rhodopsin. J. Biol. Chem. 269:23879–23881. - PubMed
-
- Barber-Armstrong, W., T. Donaldson, H. Wijesooriya, R. A. Silva, and S. M. Decatur. 2004. Empirical relationships between isotope-edited IR spectra and helix geometry in model peptides. J. Am. Chem. Soc. 126:2339–2345. - PubMed
-
- Barth, A. 2000. The infrared absorption of amino acid side chains. Prog. Biophys. Mol. Bio. 74:141–173. - PubMed
-
- Bergo, V., E. N. Spudich, J. Spudich, and K. J. Rothschild. 2003. Conformational changes detected in a sensory rhodopsin II-transducer complex. J. Biol. Chem. 278:36556–36562. - PubMed
Publication types
MeSH terms
Substances
LinkOut - more resources
Full Text Sources
