

Repetitive transient depolarizations of the inner mitochondrial membrane induced by proton pumping
- PMID: 15653749
- PMCID: PMC1305282
- DOI: 10.1529/biophysj.104.041483
Repetitive transient depolarizations of the inner mitochondrial membrane induced by proton pumping
Abstract
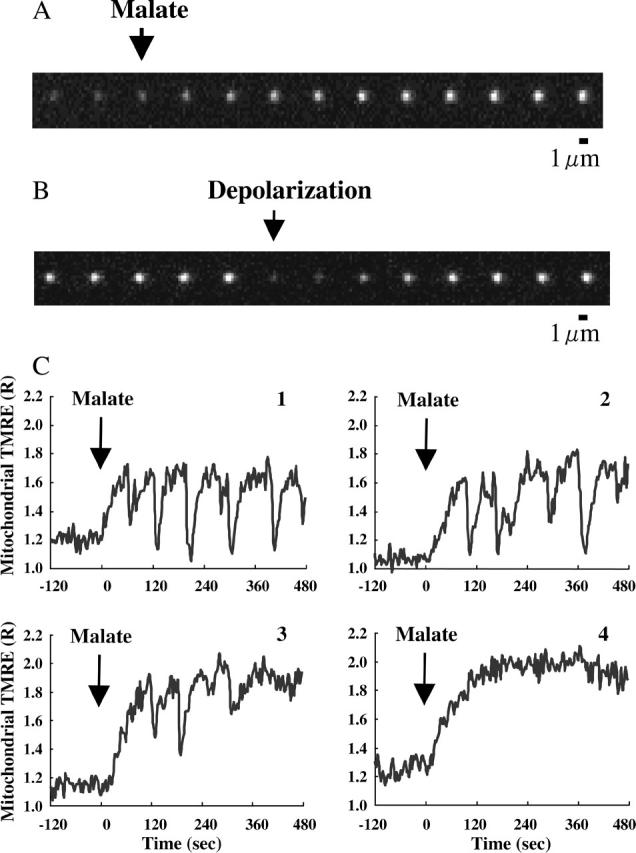
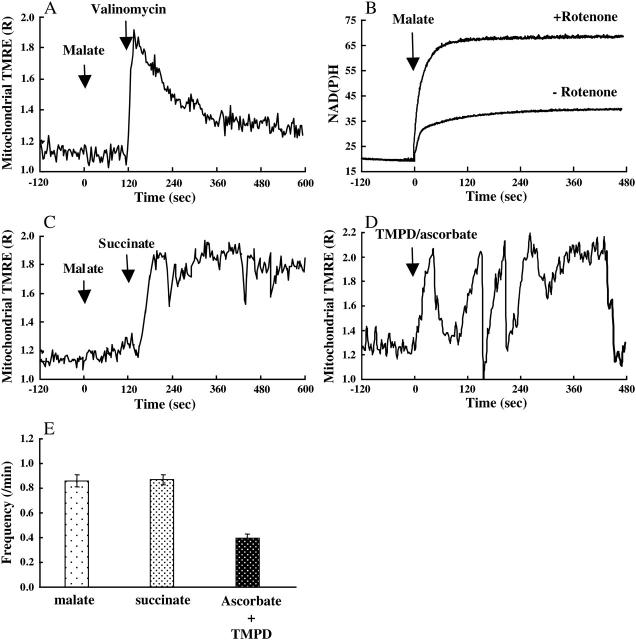
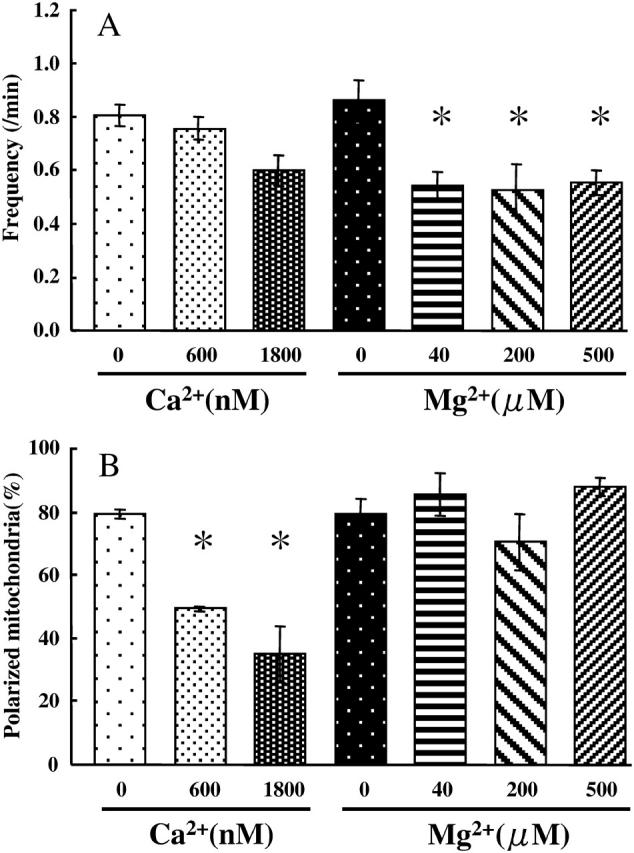
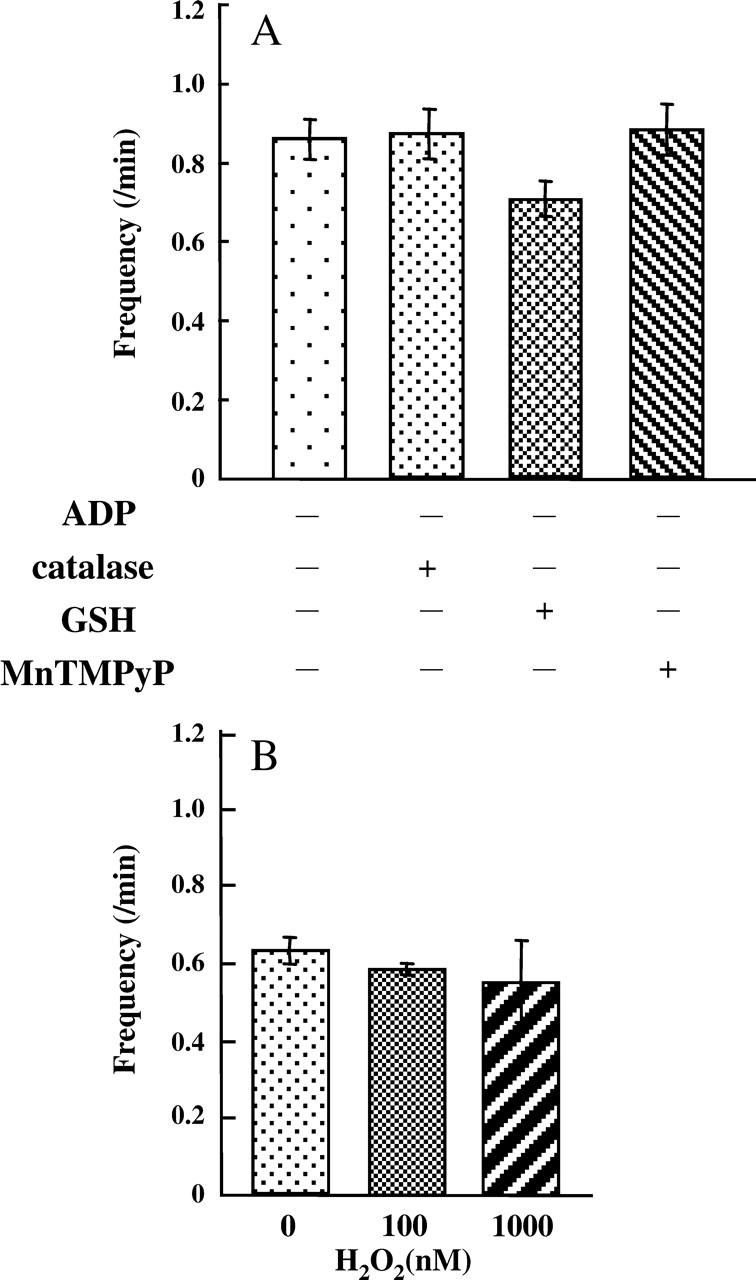
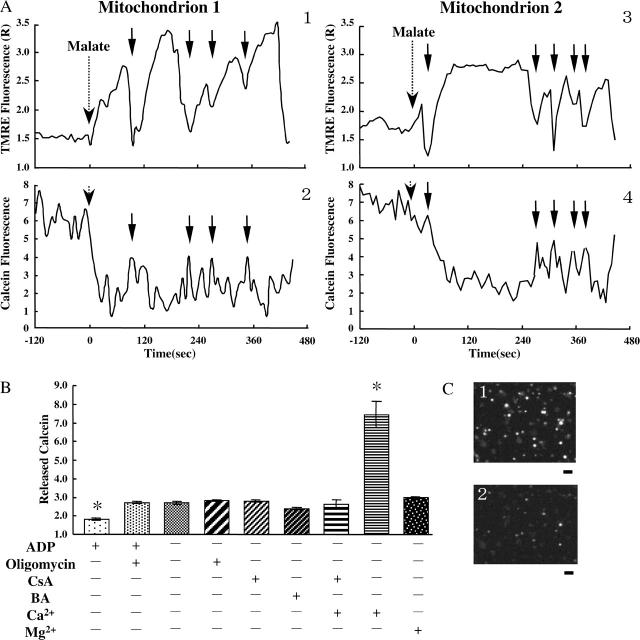
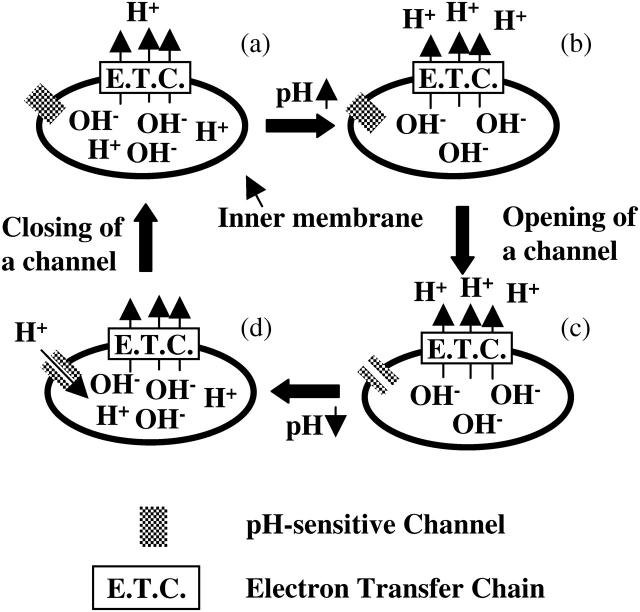
Single mitochondria show the spontaneous fluctuations of DeltaPsim. In this study, to examine the mechanism of the fluctuations, we observed DeltaPsim in single isolated heart mitochondria using time-resolved fluorescence microscopy. Addition of malate, succinate, or ascorbate plus TMPD to mitochondria induced polarization of the inner membrane followed by repeated cycles of rapid depolarizations and immediate repolarizations. ADP significantly decreased the frequency of the rapid depolarizations, but the ADP effect was counteracted by oligomycin. On the other hand, the rapid depolarizations did not occur when mitochondria were polarized by the efflux of K(+) from the matrix. The rapid depolarizations became frequent with the increase in the substrate concentration or pH of the buffer. These results suggest that the rapid depolarizations depend on the net translocation of protons from the matrix. The frequency of the rapid depolarizations was not affected by ROS scavengers, Ca(2+), CsA, or BA. In addition, the obvious increase in the permeability of the inner membrane to calcein (MW 623) that was entrapped in the matrix was not observed upon the transient depolarization. The mechanisms of the spontaneous oscillations of DeltaPsim are discussed in relation to the matrix pH and the permeability transitions.
Figures

Similar articles
-
Stability of membrane potential in heart mitochondria: single mitochondrion imaging.Biochem Biophys Res Commun. 2006 Jun 16;344(4):1094-101. doi: 10.1016/j.bbrc.2006.03.233. Epub 2006 Apr 19. Biochem Biophys Res Commun. 2006. PMID: 16647039
-
Fluctuations in mitochondrial membrane potential caused by repetitive gating of the permeability transition pore.Biochem J. 1999 Oct 15;343 Pt 2(Pt 2):311-7. Biochem J. 1999. PMID: 10510294 Free PMC article.
-
Fluctuations in mitochondrial membrane potential in single isolated brain mitochondria: modulation by adenine nucleotides and Ca2+.Biophys J. 2004 Nov;87(5):3585-93. doi: 10.1529/biophysj.104.042671. Epub 2004 Aug 17. Biophys J. 2004. PMID: 15315954 Free PMC article.
-
Spontaneous changes in mitochondrial membrane potential in single isolated brain mitochondria.Biophys J. 2003 Nov;85(5):3358-66. doi: 10.1016/S0006-3495(03)74755-9. Biophys J. 2003. PMID: 14581237 Free PMC article.
-
Fluorescence imaging of metabolic responses in single mitochondria.Biochem Biophys Res Commun. 2002 Jan 11;290(1):23-8. doi: 10.1006/bbrc.2001.6185. Biochem Biophys Res Commun. 2002. PMID: 11779127
Cited by
-
Perspectives on: SGP symposium on mitochondrial physiology and medicine: the renaissance of mitochondrial pH.J Gen Physiol. 2012 Jun;139(6):415-23. doi: 10.1085/jgp.201110767. J Gen Physiol. 2012. PMID: 22641636 Free PMC article. Review. No abstract available.
-
Hitting the Bull's-Eye in Metastatic Cancers-NSAIDs Elevate ROS in Mitochondria, Inducing Malignant Cell Death.Pharmaceuticals (Basel). 2015 Feb 13;8(1):62-106. doi: 10.3390/ph8010062. Pharmaceuticals (Basel). 2015. PMID: 25688484 Free PMC article. Review.
-
OPA1 promotes pH flashes that spread between contiguous mitochondria without matrix protein exchange.EMBO J. 2013 Jul 3;32(13):1927-40. doi: 10.1038/emboj.2013.124. Epub 2013 May 28. EMBO J. 2013. PMID: 23714779 Free PMC article.
-
Transitional correlation between inner-membrane potential and ATP levels of neuronal mitochondria.Sci Rep. 2018 Feb 14;8(1):2993. doi: 10.1038/s41598-018-21109-2. Sci Rep. 2018. PMID: 29445117 Free PMC article.
-
OMA1 protease eliminates arrested protein import intermediates upon mitochondrial depolarization.J Cell Biol. 2024 May 6;223(5):e202306051. doi: 10.1083/jcb.202306051. Epub 2024 Mar 26. J Cell Biol. 2024. PMID: 38530280 Free PMC article.
References
-
- Aon, M. A., S. Cortassa, E. Marban, and B. O'Rourke. 2003. Synchronized whole cell oscillations in mitochondrial metabolism triggered by a local release of reactive oxygen species in cardiac myocytes. J. Biol. Chem. 278:44735–44744. - PubMed
-
- Arsenijevic, D., H. Onuma, C. Pecqueur, S. Raimbault, B. S. Manning, B. Miroux, E. Couplan, M.-C. Alves-Guerra, M. Goubern, R. Surwit, F. Bouillaud, D. Richard, and others. 2000. Disruption of the uncoupling protein-2 gene in mice reveals a role in immunity and reactive oxygen species production. Nat. Genet. 26:435–439. - PubMed
-
- Baracca, A., G. Sgarbi, G. Solaini, and G. Lenaz. 2003. Rhodamine 123 as a probe of mitochondrial membrane potential: evaluation of proton flux through F(0) during ATP synthesis. Biochim. Biophys. Acta. 1606:137–146. - PubMed
-
- Beavis, A. D., and H. Davatol-Hag. 1996. The mitochondrial inner membrane anion channel is inhibited by DIDS. J. Bioenerg. Biomembr. 28:207–214. - PubMed
-
- Beavis, A. D., and M. F. Powers. 1989. On the regulation of the mitochondrial inner membrane anion channel by magnesium and protons. J. Biol. Chem. 264:17148–17155. - PubMed
Publication types
MeSH terms
Substances
LinkOut - more resources
Full Text Sources
Miscellaneous
