

doi: 10.1073/pnas.0408954102.
Epub 2005 Jan 14.
Directing cell migration with asymmetric micropatterns
Affiliations
- PMID: 15653772
- PMCID: PMC545855
- DOI: 10.1073/pnas.0408954102
Item in Clipboard
Directing cell migration with asymmetric micropatterns
Proc Natl Acad Sci U S A.
.
Abstract
This report shows that the direction of polarization of attached mammalian cells determines the direction in which they move. Surfaces micropatterned with appropriately functionalized self-assembled monolayers constrain individual cells to asymmetric geometries (for example, a teardrop); these geometries polarize the morphology of the cell. After electrochemical desorption of the self-assembled monolayers removes these constraints and allows the cells to move across the surface, they move toward their blunt ends.
Figures
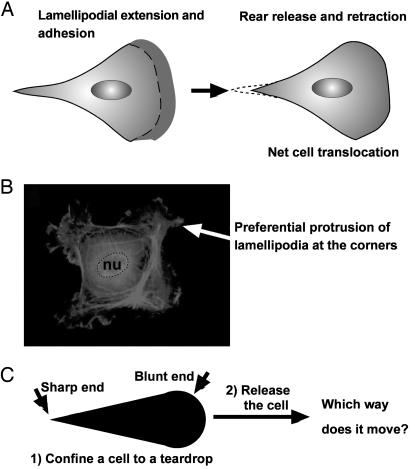
A problem on cell motility. (A) A cartoon illustration of the migration of a typical mammalian cell on a flat surface. This teardrop shape is found in many types of cells. (B) Cells confined to squares preferentially extend their lamellipodia from the corners. nu, nucleus. (C) If a cell is confined to a shape of teardrop, will the cell preferentially extend its lamellipodia from the sharp end or from the blunt end? If released from confinement, in which direction will it likely move?
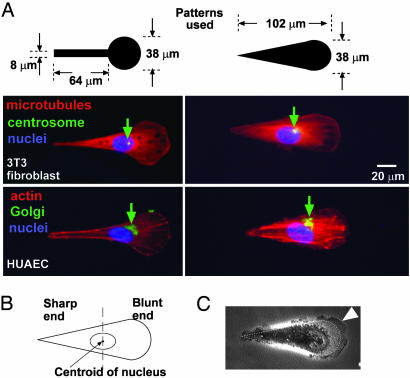
Asymmetric patterns polarize immobilized cells. (A) The Golgi and the centrosome are located closer to the half of a cell with the blunt end. We used phallodin, antigolgin, DAPI, antitubulin, and antipericentrin to identify actin (red), the Golgi (green), the nucleus (blue), microtubules (red), and the centrosome (green), respectively. The green arrows indicate the location of centrosomes in 3T3 cells and Golgi in human umbilical artery endothelial cells (HUAEC). (B) We divided the cell into a half with the sharp end and a half with the blunt end by a vertical line drawn at the centroid of the nucleus; >80% (n = 30) of the centrosomes and Golgi were localized in the region of the wide end. (C) The lamellipodia of immobilized 3T3 cells tended to extend more from the blunt end as well (arrowhead). The dotted line indicates the edges of the adhesive pattern.
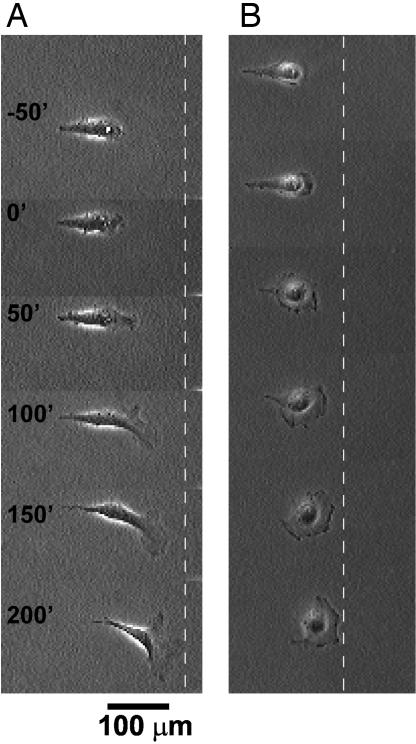
Time-lapse images (in minutes) show the motility of an initially polarized 3T3 fibroblast after its constraint is released. (A) We applied the voltage pulse at time t = 0. The dotted line serves as a reference for the location of the cell. (B) Another type of cell, COS-7, shows similar behavior.
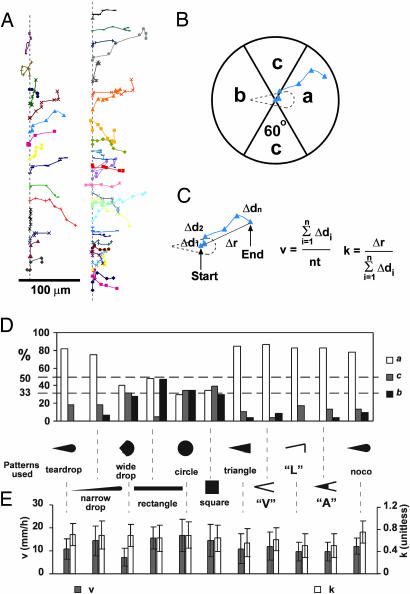
Quantification of the motion of 3T3 cells after release. (A) The traces connect the positions of the centroids of cells at 50-min intervals to show their trajectories. The traces are offset vertically along the dotted line for clarity. Each trace (and color) follows a separate cell. (B) Assigning a direction to an observed trajectory. (C) Definition of v and k. Δdn is the distance of cell movement in a given step, n is the number of steps measured, and t is the time interval between each step. (D) Statistical summaries of the direction of motion of the motile cells on various patterns used in this study. A random distribution among the three regions corresponds to 33%. For the last sample (indicated by “noco”), we initially confined cells to a teardrop shape, then treated them with nocodazole to disrupt their microtubules. We then released them electrochemically and immediately replaced the medium to allow them to reassemble their microtubules. See text for more details. We counted at least 23 cells for each pattern. (Error bars indicate one SD from the mean.) (E) A summary of v and k for cells on each pattern.
References
-
- Alberts, B., Johnson, A., Lewis, J., Raff, M., Keith, R. & Walter, P. (2002) Molecular Biology of the Cell (Garland, New York).
-
- Lauffenburger, D. A. & Horwitz, A. F. (1996) Cell 84, 359–369. - PubMed
-
- Whitesides, G. M., Ostuni, E., Takayama, S., Jiang, X. & Ingber, D. E. (2001) Ann. Rev. Biomed. Eng. 3, 335–373. - PubMed
-
- Jiang, X., Ferrigno, R., Mrksich, M. & Whitesides, G. M. (2003) J. Am. Chem. Soc. 125, 2366–2367. - PubMed
-
- Verkhovsky, A. B., Svitkina, T. M. & Borisy, G. G. (1999) Curr. Biol. 9, 11–20. - PubMed
Publication types
MeSH terms
Grants and funding
LinkOut - more resources
Full Text Sources
Other Literature Sources
Molecular Biology Databases
