. 2005 Jan 15;118(Pt 2):433-46.
doi: 10.1242/jcs.01622.

Neurite extension in central neurons: a novel role for the receptor tyrosine kinases Ror1 and Ror2

Affiliations

Neurite extension in central neurons: a novel role for the receptor tyrosine kinases Ror1 and Ror2

Sabrina Paganoni et al. J Cell Sci. .

Abstract

Neurite elongation and branching are key cellular events during brain development as they underlie the formation of a properly wired neuronal network. Here we report that the receptor tyrosine kinases Ror1 and Ror2 modulate the growth of neurites as well as their branching pattern in hippocampal neurons. Upon Ror1 or Ror2 suppression using antisense oligonucleotides or RNA interference (RNAi), neurons extended shorter and less branched minor processes when compared to those in control cells. In addition, Ror-depleted cells elongated longer, albeit less branched, axons than seen in control cells. Conversely, Ror overexpression both in non-neuronal cells and in hippocampal neurons resulted in the enhanced extension of short and highly branched processes. These phenotypes were accompanied by changes in the microtubule-associated proteins MAP1B and MAP2. Taken together, these results support a novel role for Ror receptors as modulators of neurite extension in central neurons.


Figures
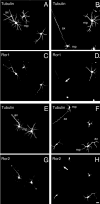
Fig. 1
Fig. 1
Ror1 and Ror2 suppression by antisense oligonucleotide treatment in cultured hippocampal neurons. 2-day cultured control (A,C,E,G), Ror1 antisense- (B,D) and Ror2 antisense- (F,H) treated hippocampal neurons were double stained with tubulin (A,B,E,F) and Ror1 (C,D) or Ror2 (G,H) antibodies. Ror1 and Ror2 were readily detectable in the soma, the neurites and the growth cones of control neurons (C,G). On the other hand, very little Ror immunoreactivity was found in many of the neurons treated with Ror1 or Ror2 oligonucleotides (arrows in D,H). Tubulin expression was not affected by Ror1 and Ror2 antisense oligonucleotide treatment (B,F). ax, axon; mp, minor process. Bar, 20 μm.
Fig. 2
Fig. 2
Ror1 and Ror2 suppression by RNAi in cultured hippocampal neurons. (A-H) 2- day cultured control (A,C,E,G), siRNA Ror1- (B,D) and siRNA Ror2- (F,H) treated hippocampal neurons were double stained with tubulin (A,B,E,F) and Ror1 (C,D) or Ror2 (G,H) antibodies. Transfection with the cognate siRNA duplex reduced Ror1 and Ror2 expression in neurons from the targeted cultures (arrows in D,H), leaving their tubulin expression unaffected (B,F). Panels on the right represent the distribution function of the immunoreactivity pixel intensity of Ror1 and tubulin (upper panel) and Ror2 and tubulin (lower panel) in control and targeted hippocampal neurons. Controls included non-transfected neurons (CTR) and neurons transfected with oligomers carrying a 2 base pair mutation (siRNA MUT) or scrambled oligomers (siRNA SCR). Note the shift in the expression levels of Ror1 and Ror2, but not of tubulin, in the targeted cultures when compared to controls. ax, axon; gc, growth cone; mp, minor process. Bar, 20 μm.
Fig. 3
Fig. 3
Reduction of Ror1 and Ror2 expression by RNAi in hippocampal cultures. Western blot analysis of whole cell extracts prepared from 2-day in vitro untreated hippocampal cultures (A and B, lane 1), cultures that had been transfected with Ror1 (A, lane 2) or Ror2 (B, lane 2) siRNA duplexes and cultures that had been transfected with the corresponding scrambled oligomers (A and B, lane 3). The proteins were separated by SDS-PAGE and immunoblots were reacted with Ror1 (A) and Ror2 (B) antibodies. Densitometries of the immunoreactive bands are shown under the blot. Values were normalized using tubulin as an internal control. The results correspond to the percentage of Ror1 and Ror2 protein present in the RNAi-transfected cultures as compared to the levels detected in the untreated controls (100%). *P<0.01 compared to levels in untreated and scrambled siRNA-treated cultures.
Fig. 4
Fig. 4
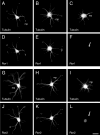
Effect of Ror1 and Ror2 suppression by antisense oligonucleotide treatment on stage II hippocampal neurons. One-day cultured control (A,D,G,J), Ror1 sensetreated (B,E), Ror2 sense-treated (H,K), Ror1 antisense-treated (C,F) and Ror2 antisense-treated (I,L) hippocampal neurons were double stained with tubulin (A-C, G-I) and Ror1 (D-F) or Ror2 (J-L) antibodies. Ror1 and Ror2 suppression by the corresponding antisense oligonucleotide (arrows in F,L) was accompanied by the elongation of shorter and less branched minor processes (mp). Bar, 20 μm.
Fig. 5
Fig. 5
Effect of Ror1 and Ror2 suppression by antisense oligonucleotide treatment on stage III hippocampal neurons. 2-day in culture control (A,D,G,J), Ror1 sense-treated (B,E), Ror2 sensetreated (H,K), Ror1 antisensetreated (C,F) and Ror2 antisensetreated (I,L) hippocampal neurons were double stained with tubulin (A-C, G-I) and Ror1 (D-F) or Ror2 (J-L) antibodies. Ror-depleted neurons elongated shorter minor processes (mp) but longer axons (ax) than control neurons (arrows in F,L). Bar, 20 μm.
Fig. 6
Fig. 6
Overexpression of Ror1 and Ror2 in HEK cells. HEK cells were transfected with expression plasmids encoding mouse Ror1 or Ror2 cDNAs and harvested 48 hours later for analysis. (A) Reverse transcription-polymerase chain reaction (RT-PCR) and (B) western blot analysis of pcDNA3-mRor1-Flag (A and B, lane 2) and pcDNA3-mRor2-Flag (A and B, lane 3) transfected HEK cultures. As a control, untreated HEK cultures were used (A and B, lane 1). (C-H) pcDNA3-mRor1-Flag-transfected (C,E,F,H) and pcDNA3-mRor2-Flag-transfected (D,G) HEK cells were stained with anti-Flag (C,D) or anti-Ror1 (E) antibodies. Note the distribution of Ror1 and Ror2 in the soma and in filopodia-like protrusions (arrows in C-E). (I-L) pcDNA3-mRor1-Flag-transfected (I,K) and pcDNA3-mRor2-Flag-transfected (J,L) HEK cells were stained with an anti-Flag antibody (I,J) and counterstained with phalloidin (K,L) to demonstrate the colocalization of Ror proteins with F-actin (arrows in I-L). Bar, 20 μm.
Fig. 7
Fig. 7
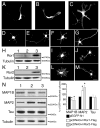
Overexpression of Ror1 and Ror2 in astrocytes and hippocampal neurons. Primary astrocytes (A-C) and hippocampal neurons (D-M) were transfected with pEGFP-N1 (A,D,E), pcDNA3 (F,G), pcDNA3-mRor1-Flag (B,I,J) or pcDNA3- mRor2-Flag (C,L,M). Cultures were fixed 24 (A-D, F,I,L) or 48 (E,G,J,M) hours later and stained with GFP (A,D,E), tubulin (F,G) or Flag (B,C,I,J,L,M) antibodies. (H) Lysates from 2-day in vitro sister cultures were analyzed by western blotting to demonstrate overexpression of Ror1. pcDNA3, pEGFP-N1- and pcDNA3-mRor1- Flag-transfected cultures were loaded in lanes 1, 2 and 3, respectively. Membranes were probed with anti-Ror1 and tubulin antibodies. A tenfold increase in Ror1 expression was detected, compared to control levels. (K) Lysates from 2-day in vitro sister cultures of hippocampal neurons were analyzed by western blotting to demonstrate overexpression of Ror2. pcDNA3, pEGFP-N1- and pcDNA3-mRor2- Flag-transfected cultures were loaded in lanes 1, 2 and 3, respectively. Membranes were probed with anti-Flag and tubulin antibodies. (N) Lysates from 2-day in vitro sister cultures were subjected to western blot analysis (pEGFP-N1-, pcDNA3- mRor1-Flag- and pcDNA3-mRor2-Flag-transfected cultures were loaded in lanes 1, 2 and 3, respectively). Densitometries of the immunoreactive bands obtained by western blotting with MAP1B, MAP2 and tau antibodies are shown. The results correspond to the percentage of MAP1B, MAP2 and tau protein levels present in the pcDNA3-mRor1- and pcDNA3-mRor2-Flag-transfected cultures when considering the levels in the GFP-transfected samples as 100%. *P<0.01 compared to protein levels in pEGFP-N1-transfected cultures. Bar, 20 μm.
Fig. 8
Fig. 8
Ror suppression is accompanied by changes in the levels of the microtubule-associated proteins MAP1B and MAP2. Western blot analysis of whole cell extracts prepared from 2-day in vitro untreated hippocampal cultures (A and B, lane 1), cultures that had been transfected with Ror1 (A, lane 2) or Ror2 (B, lane 2) siRNA duplexes and cultures that had been transfected with the corresponding scrambled siRNAs (A and B, lane 3). Densitometries of the immunoreactive bands obtained by western blotting with MAP1B, MAP2 and tau antibodies are shown below the blots. The results correspond to the percent of MAP1B, MAP2 and tau protein levels present in the siRNA-transfected cultures when considering the levels in the control samples as 100%. Note the significant decrease of MAP1B and MAP2, but not tau, levels in the siRNA Ror1 and Ror2-treated cultures when compared to levels in control cells. *P<0.01 when compared to levels in untreated and scrambled siRNA-treated cultures.

Similar articles

Cited by

References

    1. Aigner L, Caroni P. Absence of persistent spreading, branching, and adhesion in GAP-43-depleted growth cones. J Cell Biol. 1995;128:647–660. - PMC - PubMed
    1. Al-Shawi R, Ashton SV, Underwood C, Simons JP. Expression of the Ror1 and Ror2 receptor tyrosine kinase genes during mouse development. Dev Genes Evol. 2001;211:161–171. - PubMed
    1. Avila J, Dominguez J, Diaz-Nido J. Regulation of microtubule dynamics by microtubule-associated protein expression and phosphorylation during neuronal development. Int J Dev Biol. 1994;38:13–25. - PubMed
    1. Black MM, Slaughter T, Fischer I. Microtubule-associated protein 1b (MAP1b) is concentrated in the distal region of growing axons. J Neurosci. 1994;14:857–870. - PMC - PubMed
    1. Bose CM, Qiu D, Bergamaschi A, Gravante B, Bossi M, Villa A, Rupp F, Malgaroli A. Agrin controls synaptic differentiation in hippocampal neurons. J Neurosci. 2000;20:9086–9095. - PMC - PubMed

Publication types

MeSH terms

Substances