

The integration of recombination and physical maps in a large-genome monocot using haploid genome analysis in a trihybrid allium population
- PMID: 15654085
- PMCID: PMC1449564
- DOI: 10.1534/genetics.104.038687
The integration of recombination and physical maps in a large-genome monocot using haploid genome analysis in a trihybrid allium population
Abstract
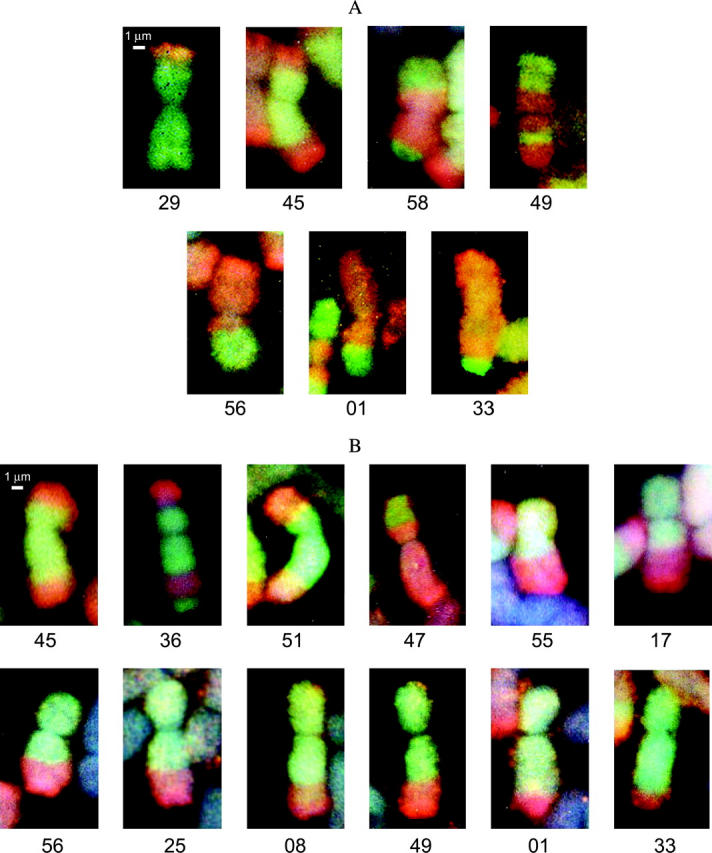
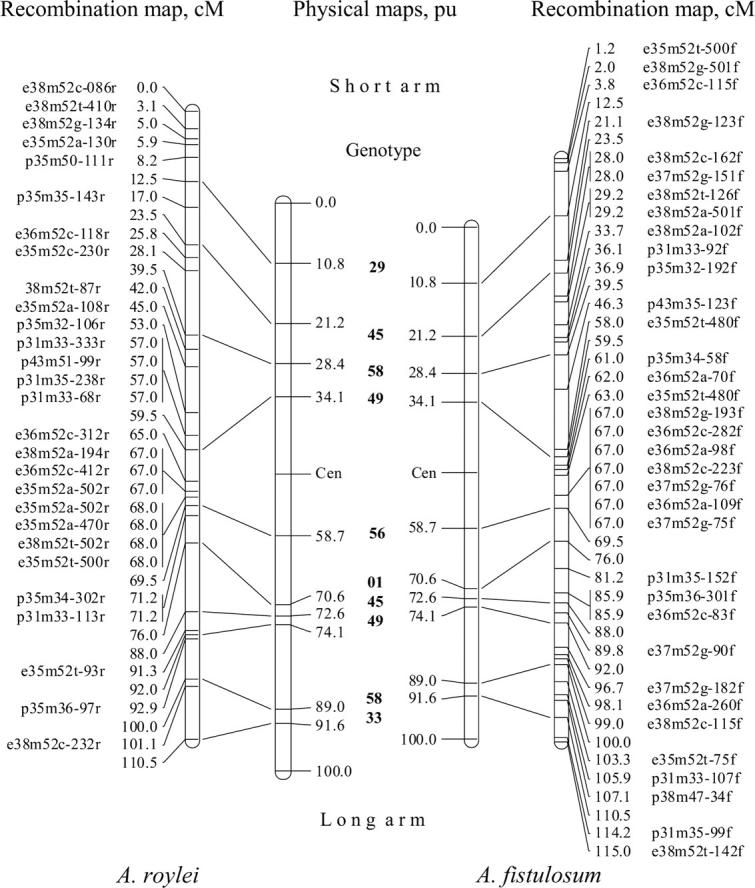
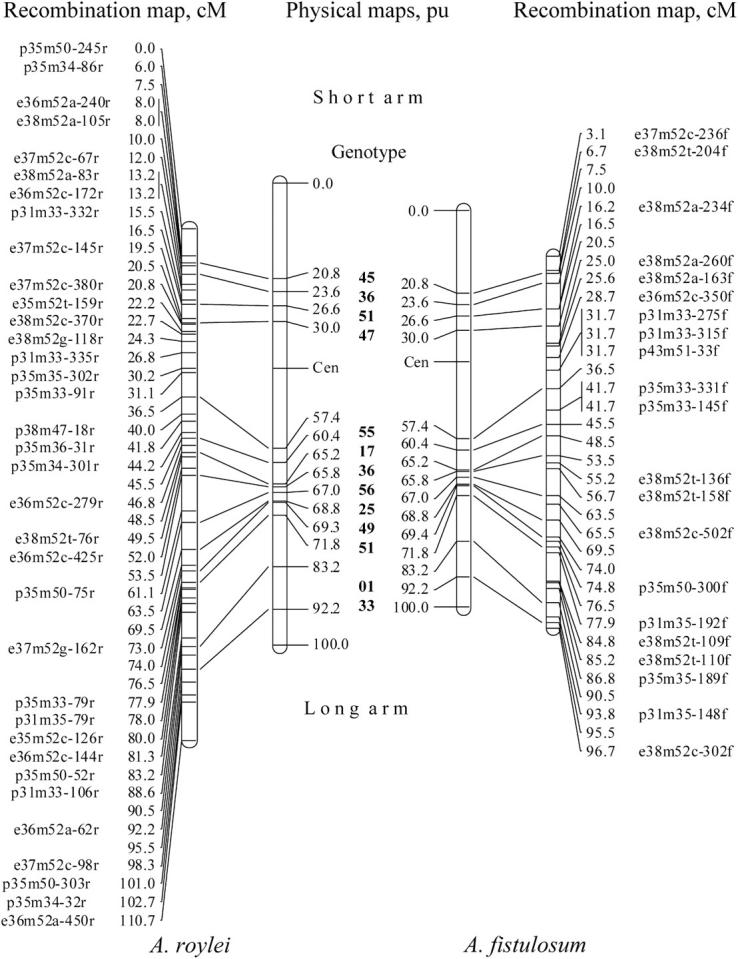
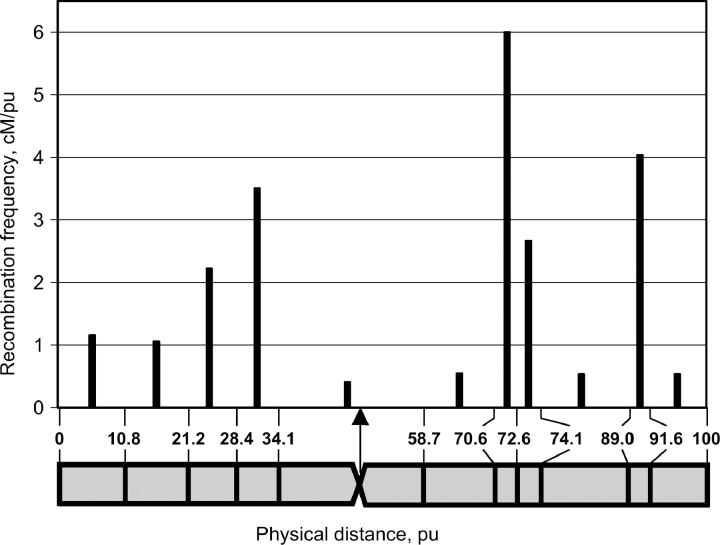
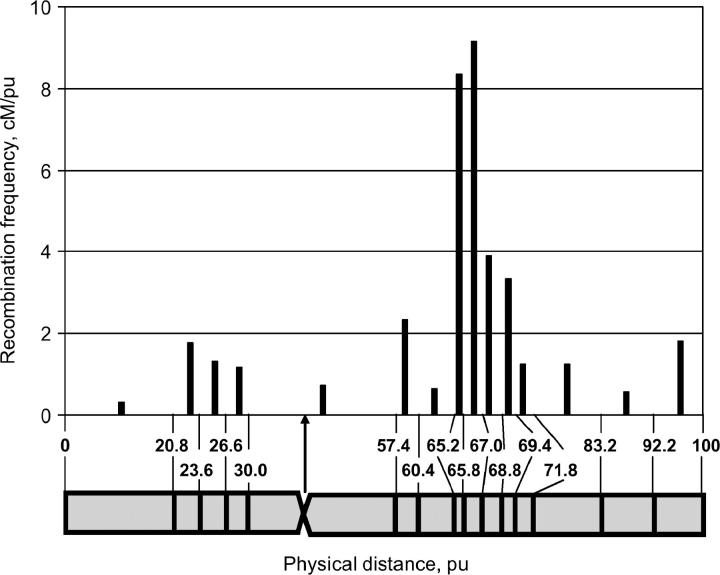
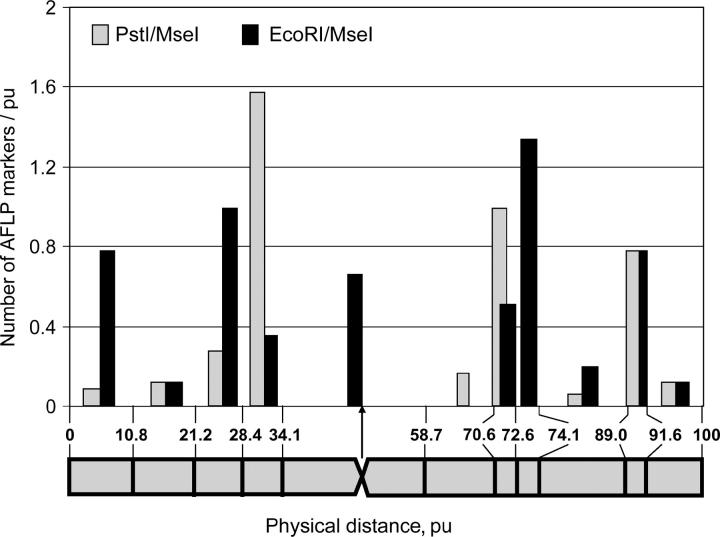
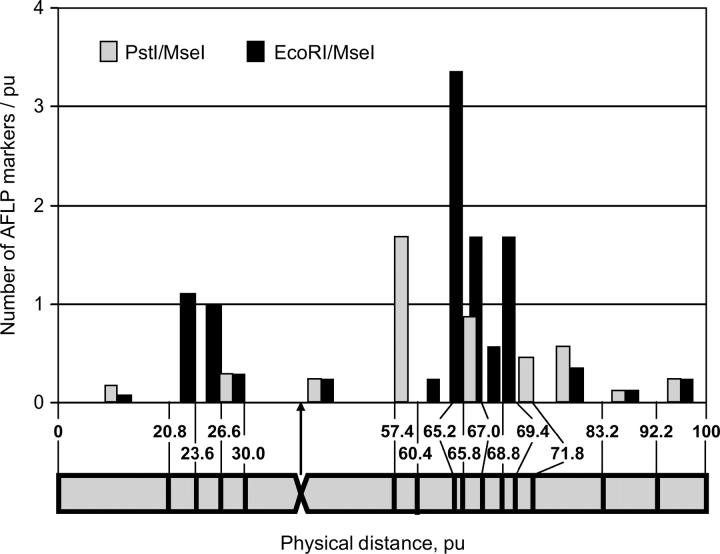
Integrated mapping in large-genome monocots has been carried out on a limited number of species. Furthermore, integrated maps are difficult to construct for these species due to, among other reasons, the specific plant populations needed. To fill these gaps, Alliums were chosen as target species and a new strategy for constructing suitable populations was developed. This strategy involves the use of trihybrid genotypes in which only one homeolog of a chromosome pair is recombinant due to interspecific recombination. We used genotypes from a trihybrid Allium cepa x (A. roylei x A. fistulosum) population. Recombinant chromosomes 5 and 8 from the interspecific parent were analyzed using genomic in situ hybridization visualization of recombination points and the physical positions of recombination were integrated into AFLP linkage maps of both chromosomes. The integrated maps showed that in Alliums recombination predominantly occurs in the proximal half of chromosome arms and that 57.9% of PstI/MseI markers are located in close proximity to the centromeric region, suggesting the presence of genes in this region. These findings are different from data obtained on cereals, where recombination rate and gene density tends to be higher in distal regions.
Figures
Similar articles
-
SNP-markers in Allium species to facilitate introgression breeding in onion.BMC Plant Biol. 2016 Aug 31;16(1):187. doi: 10.1186/s12870-016-0879-0. BMC Plant Biol. 2016. PMID: 27576474 Free PMC article.
-
[Chromosomal organization of centromeric Ty3/gypsy retrotransposons in Allium cepa L. and Allium fistulosum L].Genetika. 2014 Jun;50(6):670-6. Genetika. 2014. PMID: 25715457 Russian.
-
Genetic mapping of centromeres in the nine Citrus clementina chromosomes using half-tetrad analysis and recombination patterns in unreduced and haploid gametes.BMC Plant Biol. 2015 Mar 8;15:80. doi: 10.1186/s12870-015-0464-y. BMC Plant Biol. 2015. PMID: 25848689 Free PMC article.
-
[Cytogenetic maps and their applications in plants].Yi Chuan. 2005 Jul;27(4):659-64. Yi Chuan. 2005. PMID: 16120595 Review. Chinese.
-
Novel technologies in doubled haploid line development.Plant Biotechnol J. 2017 Nov;15(11):1361-1370. doi: 10.1111/pbi.12805. Epub 2017 Sep 11. Plant Biotechnol J. 2017. PMID: 28796421 Free PMC article. Review.
Cited by
-
Genetic analysis of the interaction between Allium species and arbuscular mycorrhizal fungi.Theor Appl Genet. 2011 Mar;122(5):947-60. doi: 10.1007/s00122-010-1501-8. Epub 2011 Jan 11. Theor Appl Genet. 2011. PMID: 21222096 Free PMC article.
-
Chromosomal Organization and Sequence Diversity of Genes Encoding Lachrymatory Factor Synthase in Allium cepa L.G3 (Bethesda). 2012 Jun;2(6):643-51. doi: 10.1534/g3.112.002592. Epub 2012 Jun 1. G3 (Bethesda). 2012. PMID: 22690373 Free PMC article.
-
The Power of Genomic in situ Hybridization (GISH) in Interspecific Breeding of Bulb Onion (Allium cepa L.) Resistant to Downy Mildew (Peronospora destructor [Berk.] Casp.).Plants (Basel). 2019 Feb 4;8(2):36. doi: 10.3390/plants8020036. Plants (Basel). 2019. PMID: 30720753 Free PMC article.
-
Meiotic crossovers characterized by haplotype-specific chromosome painting in maize.Nat Commun. 2019 Oct 10;10(1):4604. doi: 10.1038/s41467-019-12646-z. Nat Commun. 2019. PMID: 31601818 Free PMC article.
-
SNP-markers in Allium species to facilitate introgression breeding in onion.BMC Plant Biol. 2016 Aug 31;16(1):187. doi: 10.1186/s12870-016-0879-0. BMC Plant Biol. 2016. PMID: 27576474 Free PMC article.
References
-
- Alonso-Blanco, C., P. G. Goicoechea, A. Roca and R. Giraldez, 1993. A cytogenetic map on the entire length of rye chromosome 1R, including one translocation breakpoint, three isozyme loci and four C-bands. Theor. Appl. Genet. 85: 735–744. - PubMed
-
- Bennett, M. D., and I. J. Leitch, 1995. Nuclear DNA amounts in angiosperms. Ann. Bot. 76: 113–176.
-
- Boyko, E., R. Kalendar, V. Korzun, J. Fellers, A. Korol et al., 2002. A high-density cytogenetic map of the Aegilops tauschii genome incorporating retrotransposons and defense-related genes: insights into cereal chromosome structure and function. Plant Mol. Biol. 48: 767–790. - PubMed
Publication types
MeSH terms
Substances
LinkOut - more resources
Full Text Sources
