. 2005 Mar;169(3):1437-50.
doi: 10.1534/genetics.104.036111. Epub 2005 Jan 16.

Genetic control of temperature preference in the nematode Caenorhabditis elegans

Affiliations

Genetic control of temperature preference in the nematode Caenorhabditis elegans

Akiko Mohri et al. Genetics. 2005 Mar.

Abstract

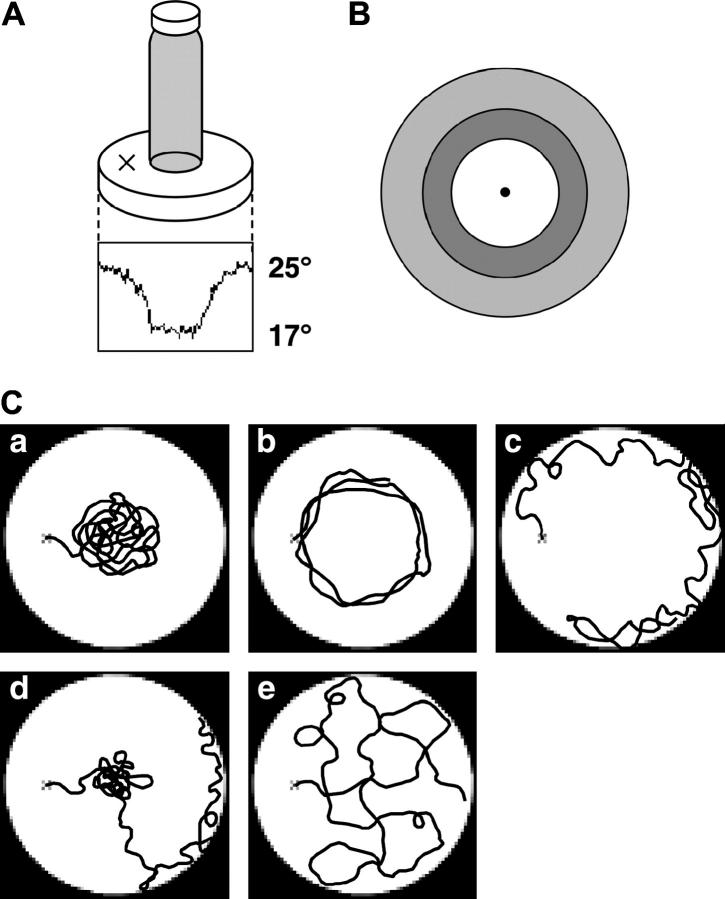
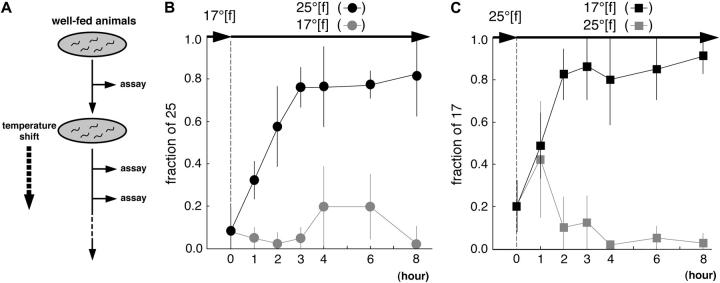
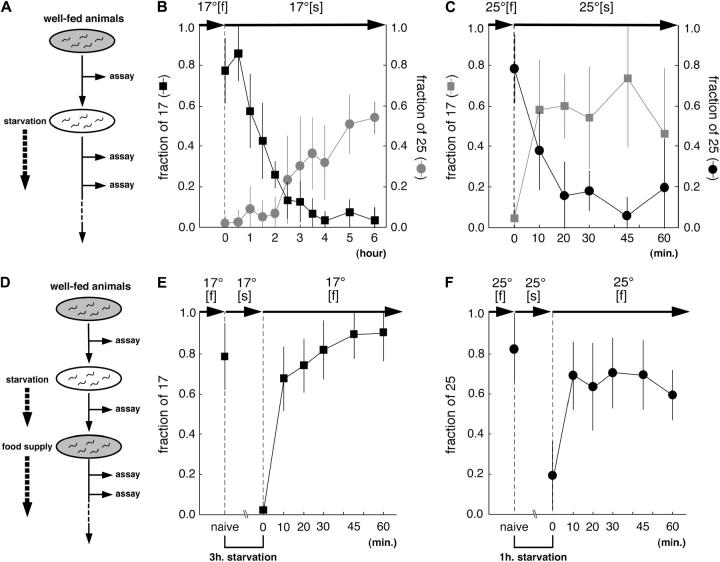
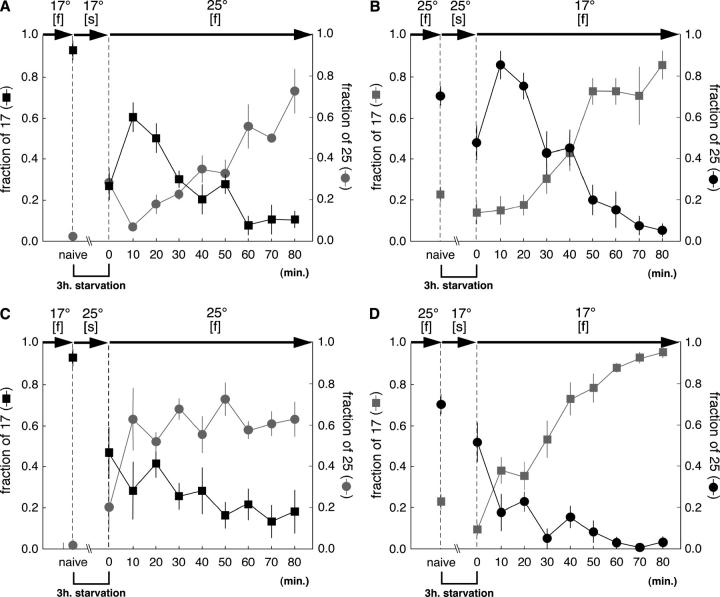
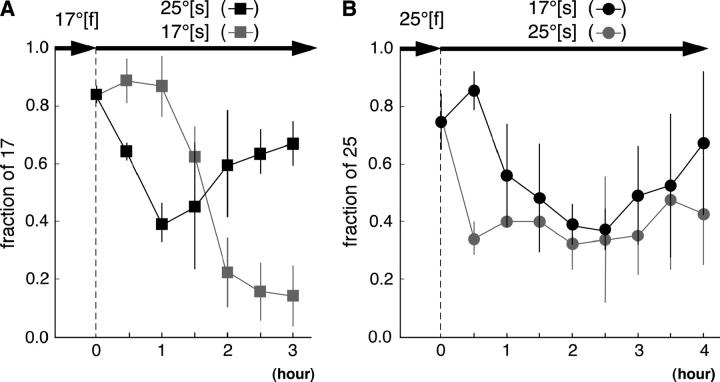
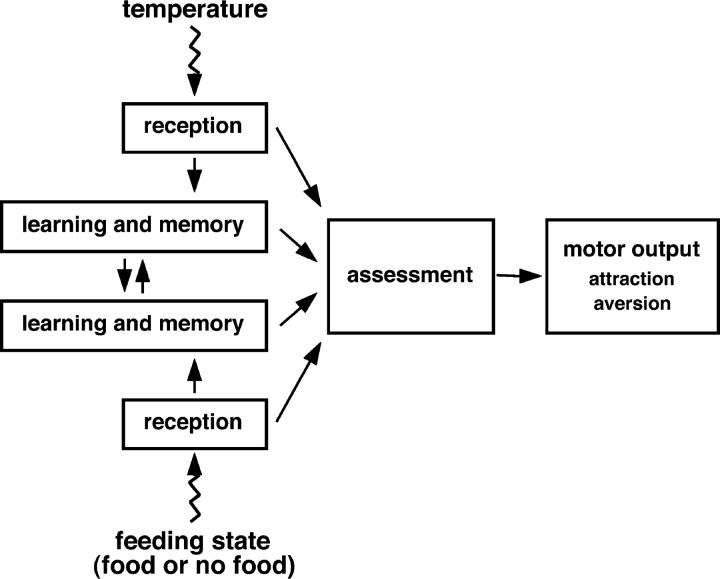
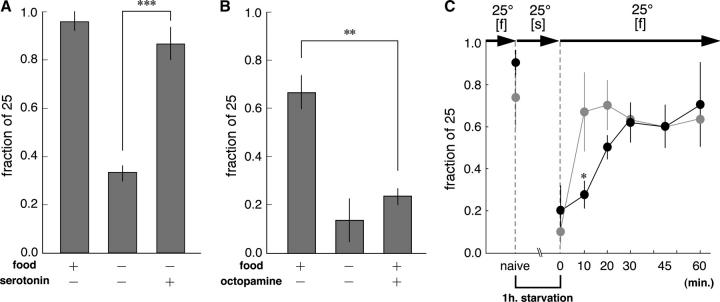
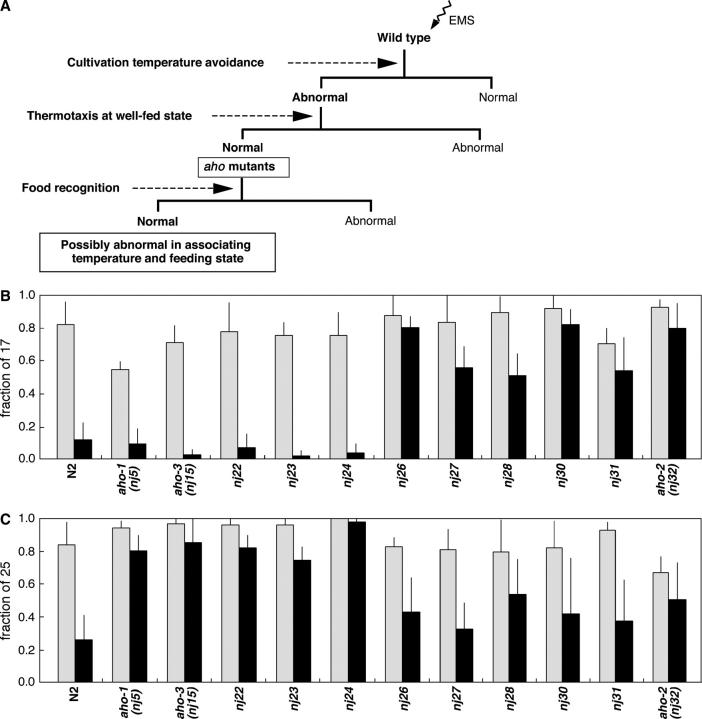
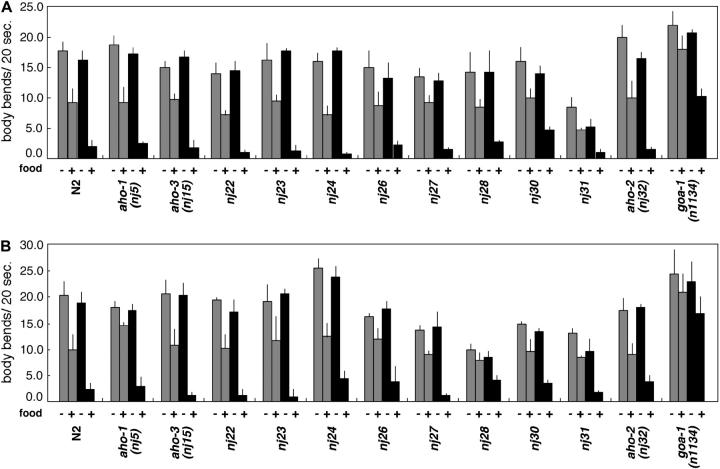
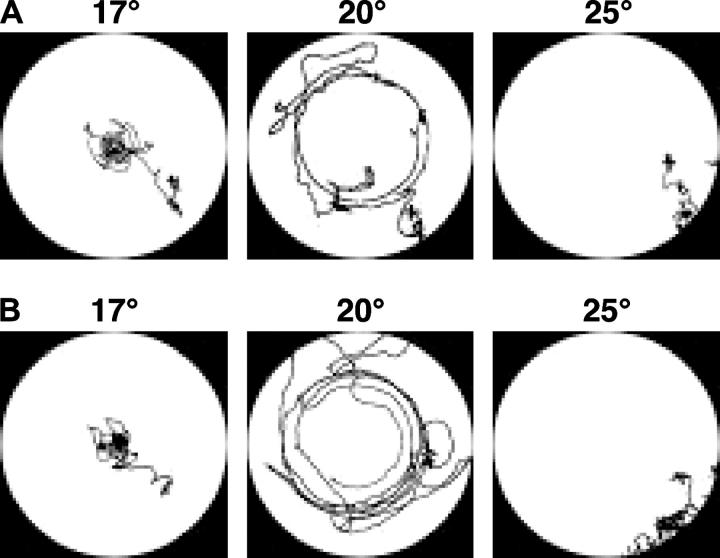
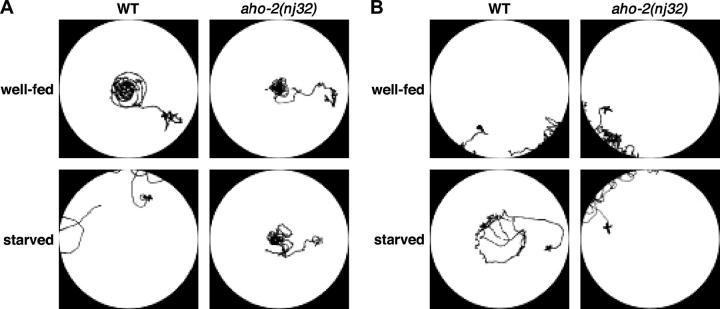
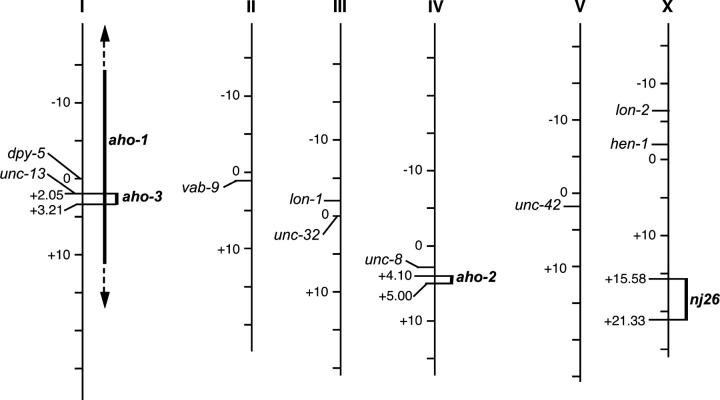
Animals modify behavioral outputs in response to environmental changes. C. elegans exhibits thermotaxis, where well-fed animals show attraction to their cultivation temperature on a thermal gradient without food. We show here that feeding-state-dependent modulation of thermotaxis is a powerful behavioral paradigm for elucidating the mechanism underlying neural plasticity, learning, and memory in higher animals. Starved experience alone could induce aversive response to cultivation temperature. Changing both cultivation temperature and feeding state simultaneously evoked transient attraction to or aversion to the previous cultivation temperature: recultivation of starved animals with food immediately induced attraction to the temperature associated with starvation, although the animals eventually exhibited thermotaxis to the new temperature associated with food. These results suggest that the change in feeding state quickly stimulates the switch between attraction and aversion for the temperature in memory and that the acquisition of new temperature memory establishes more slowly. We isolated aho (abnormal hunger orientation) mutants that are defective in starvation-induced cultivation-temperature avoidance. Some aho mutants responded normally to changes in feeding state with respect to locomotory activity, implying that the primary thermosensation followed by temperature memory formation remains normal and the modulatory aspect of thermotaxis is specifically impaired in these mutants.


Figures

F<sc>igure</sc> 1.—
Figure 1.—
Radial temperature-gradient assay. (A) Radial temperature-gradient assay was performed using a 9-cm agar plate and a vial containing frozen acetic acid. Thermograph (TVS-610, Nippon Avionics) showed the surface temperature of the plate contacting a glass vial. The stable radial temperature-gradient ranging from ∼17° to 25° was established for at least 50 min on the agar surface. One or two animals were placed on the agar at ∼22°, indicated by a cross on the assay plate. (B) The assay plate was divided into three areas: (1) an area at a distance of 0–2 cm from the center of the assay plate (open area), (2) an area at a distance of 2–3 cm from the center of the assay plate (dark shading), and (3) an area at a distance of 3–4.5 cm from the center of the assay plate (light shading). (C) Animal tracks were categorized into four groups after thermotaxis assay. Typical tracks of each category are shown in a–e. (a) Animals that moved on the open area, possibly at ∼17°–20°, were classified as “17.” (b) Animals that moved on the dark shaded area, possibly ∼20°, were classified as “20.” (c) Animals that moved on the light shaded area, possibly at ∼20°–25°, were classified as “25.” (d) Animals that moved back and forth between 17° and 25° were classified as “17/25.” (e) Animals that moved almost randomly on the plate were also classified as “17/25,” which stands for athermotactic phenotype.
F<sc>igure</sc> 2.—
Figure 2.—
The memory formation to a new temperature takes a few hours for well-fed animals in the radial temperature-gradient assay. (A) Experimental procedure for cultivation-temperature-shifted assay at the well-fed state. The solid ellipsoid indicates a conditioning plate with food. The thermotaxis behavior of naive and temperature-shifted animals was assayed at designated times after cultivation-temperature shift. (B) Cultivation temperature was shifted at the well-fed state from 17° to 25°. Animals temperature shifted after 1 hr had significant differences from naive animals (P < 0.01), and animals temperature-shifted after >2 hr had significant differences (P < 0.0001). (C) Cultivation temperature was shifted at the well-fed state from 25° to 17°. Animals temperature shifted after 1 hr had significant differences from naive animals (P < 0.01), and animals temperature shifted after >2 hr had significant differences (P < 0.0001). Thermotaxis was evaluated using “fraction of 17,” which includes the class “17,” and “fraction of 25,” which includes the class “25.” Top arrows indicate cultivation temperature and feeding state; “f” indicates cultivation with food. About 20 animals were examined at each time point in four trials. Error bar indicates SD.
F<sc>igure</sc> 3.—
Figure 3.—
Feeding states solely modulated thermotaxis behavior. (A and D) Experimental procedure for feeding-state-shifted assay at the same cultivation temperature. An ellipsoid indicates conditioning plate: a solid ellipsoid indicates cultivation with food and an open ellipsoid indicates cultivation without food. (B) Well-fed animals were transferred to conditioning plate without food at 17°. About 20 animals were examined at each time point in six trials. Animals food deprived for 1 hr had significant differences from naive animals (P < 0.01), and animals starved for >1.5 hr had significant differences (P < 0.0001). (C) Well-fed animals were transferred to conditioning plate without food at 25°. About 10 animals were examined at each time point in seven trials. Animals food deprived for >10 min had significant differences from naive animals (P < 0.0001). (E and F) Starved animals were recultivated with food at the same cultivation temperature (17° or 25°). About 10 animals were examined at each time point in 10 (17°) and 7 (25°) trials. Animals recultivated with food for >10 min had significant differences from starved animals (P < 0.0001). (B, C, E, and F) Thermotaxis was evaluated using “fraction of 17,” which includes the class “17” and “fraction of 25,” which includes the class “25.” A square indicates fraction of 17 and a circle indicates fraction of 25. Top arrows indicate cultivation temperature and feeding state; “f” indicates cultivation with food and “s” cultivation under food-deprived conditions. Error bar indicates SD.
F<sc>igure</sc> 4.—
Figure 4.—
The memory formation processes for temperature and feeding states are biologically discrete. (A) Animals conditioned to be starved at 17° for 3 hr were recultivated with food at 25°. (B) Animals conditioned to be starved at 25° for 3 hr were recultivated with food at 17°. (C) Animals conditioned to be well fed at 17° were cultivated without food at 25° for 3 hr and then recultivated with food at 25°. (D) Animals conditioned to be well fed at 25° were cultivated without food at 17° for 3 hr and then recultivated with food at 17°. (A–D) Thermotaxis was evaluated using “fraction of 17,” which includes the class “17,” and “fraction of 25,” which includes the class “25.” A square indicates fraction of 17 and a circle indicates fraction of 25. About 10 animals were examined at each time point in four trials. Top arrows indicate cultivation temperature and feeding state; “f” indicates cultivation with food and “s” cultivation under food-deprived conditions. Error bar indicates SEM.
F<sc>igure</sc> 5.—
Figure 5.—
(A) Animals conditioned to be well fed at 17° were cultivated without food. (B) Animals conditioned to be well fed at 25° were cultivated without food. (A and B) About 20 animals were examined at each time point in four trials. Top arrows are cultivation temperature and feeding state; “f” indicates cultivation with food and “s” cultivation under food-deprived conditions. Error bar indicates SEM.
F<sc>igure</sc> 6.—
Figure 6.—
A conceptual model for thermotaxis.
F<sc>igure</sc> 7.—
Figure 7.—
Exogenous serotonin and octopamine can mimic well-fed or food-deprived states, respectively, in thermotaxis. (A and B) Well-fed animals conditioned to migrate to 25° were transferred onto plates with or without drug and with or without food for 2 hr. About 10 animals were examined in three trials. (C) The delayed recovery from starved state in cat-1(e1111) mutants cultivated at 25°. The solid line indicates the result of cat-1(e1111) and the shaded line indicates the result of wild type. Top arrows indicate cultivation temperature and feeding state; “f” indicates cultivation with food and “s” cultivation under food-deprived conditions. About 10 animals were examined at each period in three trials. (A–C) Error bar indicates SEM. The statistically significant differences of thermotaxis behavior of drug-treated animals from non-drug-treated animals or thermotaxis behavior of wild-type animals from cat-1(e1111) mutants were determined by using ANOVA for repeated measures. Single, double, and triple asterisks indicate statistically significant differences, P < 0.02, P < 0.01, and P < 0.002, respectively.
F<sc>igure</sc> 8.—
Figure 8.—
A screen for mutants defective in modulation of thermotaxis affected by feeding states. (A) An experimental strategy to obtain mutants defective in neural modulation of thermotaxis by feeding states. (B) Results of 17°-thermotaxis assay for aho mutants. Shaded bars indicate results of well-fed animals and solid bars indicate results of food-deprived animals for 3 hr. (C) Results of 25°-thermotaxis assay for aho mutants. Shaded bars indicate results of well-fed animals and solid bars indicate results of food-deprived animals for 1 hr. (B and C) About 12 well-fed animals or 20 food-deprived animals were examined in at least three trials. Error bar indicates SD.
F<sc>igure</sc> 9.—
Figure 9.—
Locomotory rate assay of aho mutants. (A) Modulation of locomotory rate in aho mutants cultivated at 17°. Starved animals were conditioned by cultivation under food-deprived conditions for 2.5 hr. (B) Modulation of locomotory rate in aho mutants cultivated at 25°. Starved animals were conditioned by cultivation under food-deprived conditions for 30 min. (A and B) Shaded bars indicate results of well-fed animals that were transferred to assay plates without and with food. Solid bars indicate results of starved animals that were transferred to assay plates without and with food. Plus and minus signs indicate locomotory assay plate with food or without food: “+,” assay plates with food; “−,” assay plates without food. The goa-1(n1134) mutant showed hyperactive locomotion (Mendel et al. 1995; Segalat et al. 1995) and was used as a negative control. About 10 animals were examined in at least three trials. Error bar indicates SD.
F<sc>igure</sc> 10.—
Figure 10.—
aho-2(nj32) mutant exhibits normal thermotaxis at the well-fed state. (A) Typical tracks of well-fed wild-type animals cultivated at 17°, 20°, and 25°. (B) Typical tracks of well-fed aho-2(nj32) mutants cultivated at 17°, 20°, and 25°.
F<sc>igure</sc> 11.—
Figure 11.—
aho-2(nj32) mutant defective in cultivation-temperature avoidance induced by starvation. (A) Typical tracks of wild-type animals and aho-2(nj32) mutants cultivated at 17°. Starved animals were conditioned by cultivation under food-deprived conditions for 3 hr. (B) Typical tracks of wild-type animals and aho-2(nj32) mutants cultivated at 25°. Starved animals were conditioned by cultivation under food-deprived conditions for 1 hr.
F<sc>igure</sc> 12.—
Figure 12.—
The map position for each aho gene. Linkage groups are designated by roman numerals and X for the sex chromosome. The hen-1 mutant also exhibits Aho phenotype at 17° and 25° (Ishihara et al. 2002).

Similar articles

Cited by

References

    1. Avery, L., and H. R. Horvitz, 1990. Effects of starvation and neuroactive drugs on feeding in Caenorhabditis elegans. J. Exp. Zool. 253: 263–270. - PubMed
    1. Bargmann, C. I., 1998. Neurobiology of the Caenorhabditis elegans genome. Science 282: 2028–2033. - PubMed
    1. Brenner, S., 1974. The genetics of Caenorhabditis elegans. Genetics 77: 71–94. - PMC - PubMed
    1. Chen, C. N., S. Denome and R. L. Davis, 1986. Molecular analysis of cDNA clones and the corresponding genomic coding sequences of the Drosophila dunce+ gene, the structural gene for cAMP phosphodiesterase. Proc. Natl. Acad. Sci. USA 83: 9313–9317. - PMC - PubMed
    1. Colbert, H. A., and C. I. Bargmann, 1995. Odorant-specific adaptation pathways generate olfactory plasticity in C. elegans. Neuron 14: 803–812. - PubMed

Publication types