. 2005 Mar;169(3):1699-709.
doi: 10.1534/genetics.104.033993. Epub 2005 Jan 16.

Combining data from multiple inbred line crosses improves the power and resolution of quantitative trait loci mapping

Affiliations

Combining data from multiple inbred line crosses improves the power and resolution of quantitative trait loci mapping

Renhua Li et al. Genetics. 2005 Mar.

Abstract

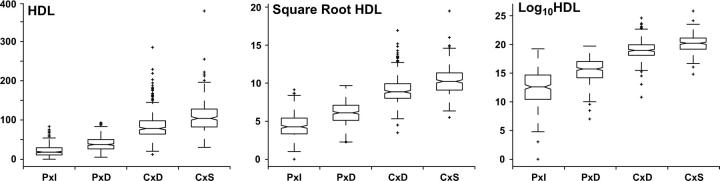
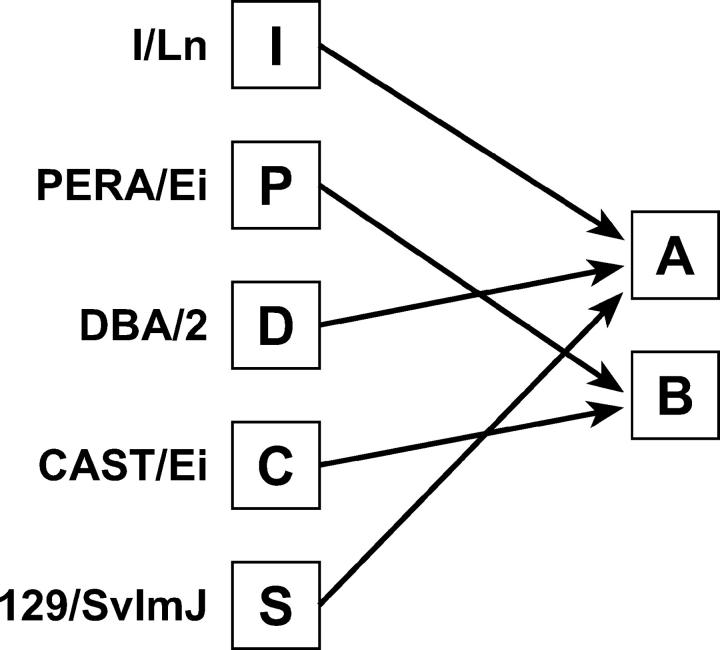
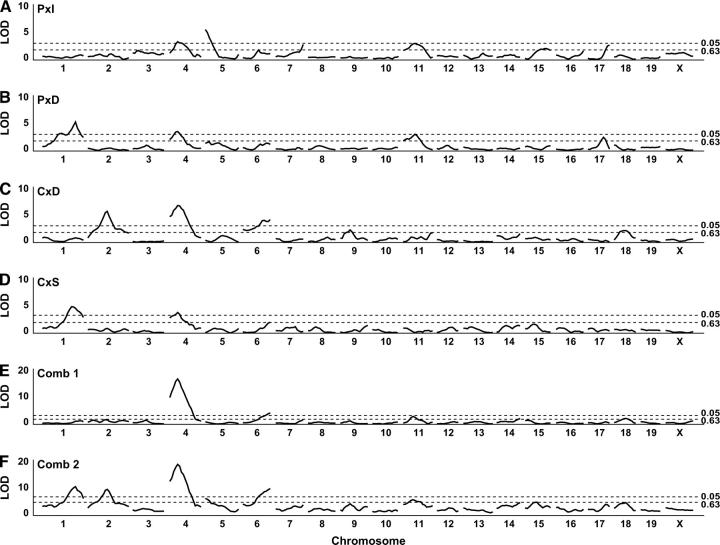
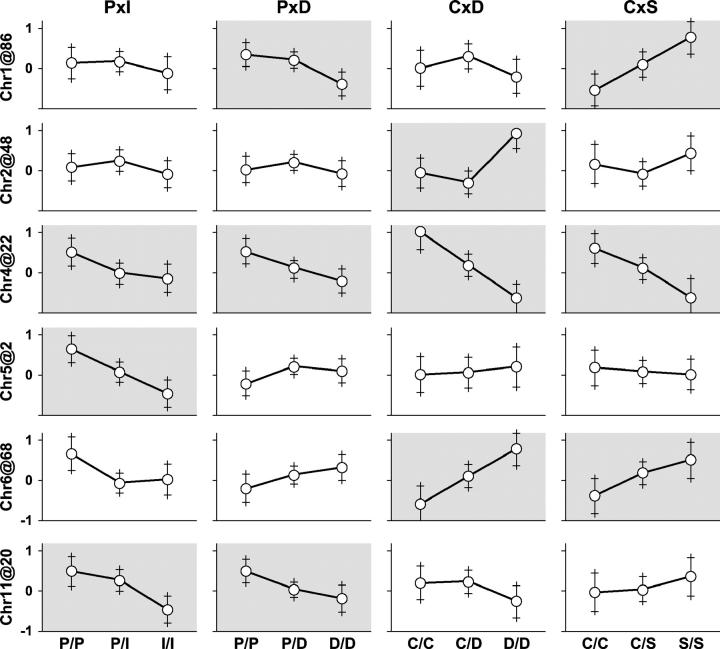
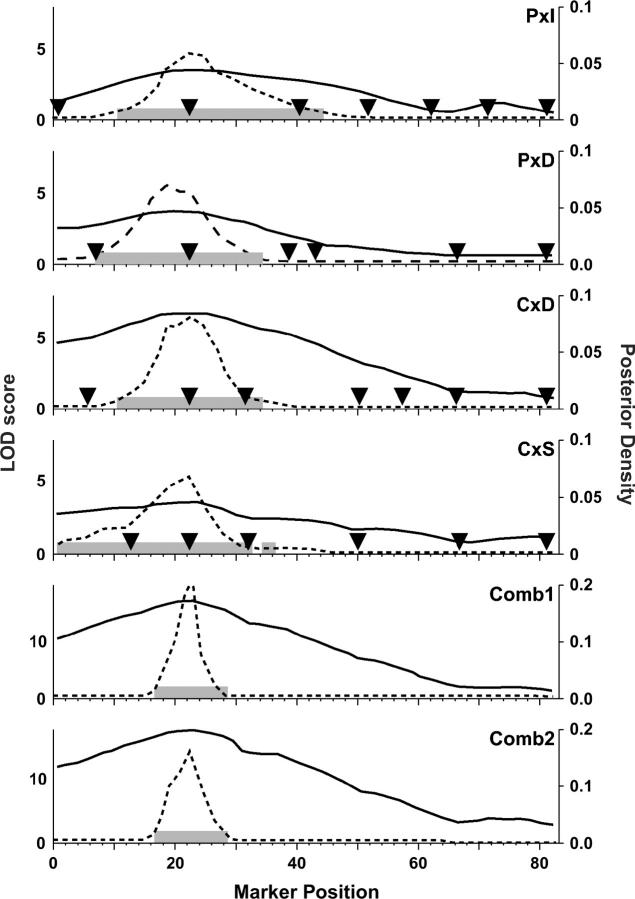
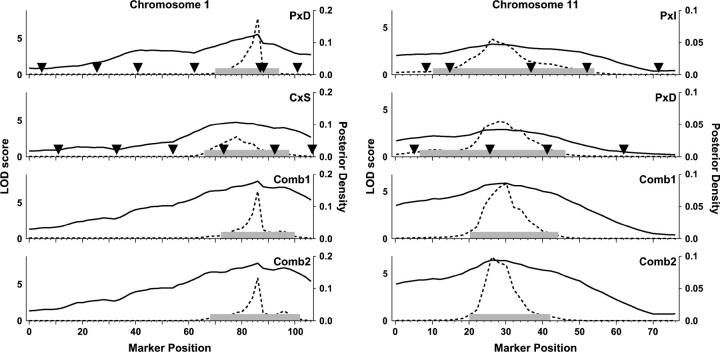
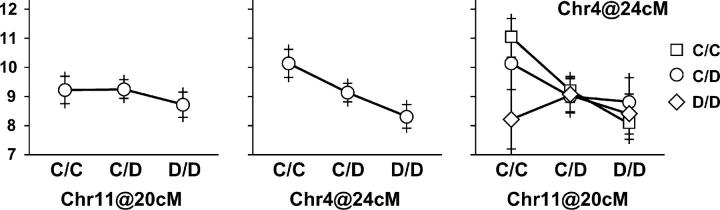
Rodent inbred line crosses are widely used to map genetic loci associated with complex traits. This approach has proven to be powerful for detecting quantitative trait loci (QTL); however, the resolution of QTL locations, typically approximately 20 cM, means that hundreds of genes are implicated as potential candidates. We describe analytical methods based on linear models to combine information available in two or more inbred line crosses. Our strategy is motivated by the hypothesis that common inbred strains of the laboratory mouse are derived from a limited ancestral gene pool and thus QTL detected in multiple crosses are likely to represent shared ancestral polymorphisms. We demonstrate that the combined-cross analysis can improve the power to detect weak QTL, can narrow support intervals for QTL regions, and can be used to separate multiple QTL that colocalize by chance. Moreover, combined-cross analysis can establish the allelic states of a QTL among a set of parental lines, thus providing critical information for narrowing QTL regions by haplotype analysis.


Figures

F<sc>igure</sc> 1.—
Figure 1.—
Box plots of the HDL phenotype by cross. Logarithmic, square-root, and untransformed data are shown.
F<sc>igure</sc> 2.—
Figure 2.—
Binary encoding of alleles for combined-cross analysis of HDL.
F<sc>igure</sc> 3.—
Figure 3.—
Genome scans for individual and combined-cross analyses. The y-axis represents the LOD score. Individual crosses are as labeled. Comb1 is the model (3) vs. model (4) LOD score. Comb2 is the model (3) vs. model (5) LOD score. Significance thresholds are 0.05 and 0.63 levels (based on 1000 permutations) and are indicated by dashed lines.
F<sc>igure</sc> 4.—
Figure 4.—
Allele-effect plots. Rows in the grid show QTL peak locations and columns show crosses. Shaded parts indicate evidence for a QTL in the individual crosses. The y-axis on each part is square root of HDL cholesterol centered on the cross-specific mean. Error bars are ±1 SE.
F<sc>igure</sc> 5.—
Figure 5.—
Localization of the chromosome 4 QTL for four individual crosses and combined crosses. The QTL alleles are encoded as PC:IDS. The solid curve is the LOD score and the dashed curve is the posterior probability density of the QTL location. Triangles indicate markers that were genotyped in the individual crosses and the 2-cM-spaced tick marks indicate the location of imputed pseudomarkers. Shaded boxes delimit 95% support intervals for the QTL location.
F<sc>igure</sc> 6.—
Figure 6.—
Posterior density of chromosome 1 (left) and chromosome 11 (right) QTL locations after recoding as shared QTL on a subset of the crosses. QTL alleles on chromosome 1 are encoded as PS:IDC. QTL alleles on chromosome 11 are encoded as P:IDCS. Details are as in Figure 5.
F<sc>igure</sc> 7.—
Figure 7.—
Interacting allele effects between the chromosome 4 and chromosome 11 QTL in cross C × D. The two leftmost parts show the main effects of QTL on chromosomes 4 and 11 and the rightmost part shows their joint effect. The vertical scale is the square root of HDL. Points indicate the mean phenotype for each genotypic group and the bar indicates 95% confidence intervals for the mean (±2 SE).

Similar articles

Cited by

References

    1. Abiola, O., J. M. Angel, P. Avner, A. A. Bachmanov, J. K. Belknap et al., 2003. The nature and identification of quantitative trait loci: a community's view. Nat. Rev. Genet. 4: 911–916. - PMC - PubMed
    1. Beck, J. A., S. Lloyd, M. Hafezparast, M. Lennon-Pierce, J. T. Eppig et al., 2000. Genealogies of mouse inbred strains. Nat. Genet. 24: 23–25. - PubMed
    1. Bonhomme, F., 1986. Evolutionary relationships in the genus Mus. Curr. Top. Microbiol. Immunol. 127: 19–34. - PubMed
    1. Broman, K. W., H. Wu, S. Sen and G. A. Churchill, 2003. R/qtl: QTL mapping in experimental crosses. Bioinformatics 19: 889–890. - PubMed
    1. Churchill, G. A., and R. W. Doerge, 1994. Empirical threshold values for quantitative trait mapping. Genetics 138: 963–971. - PMC - PubMed

Publication types

Substances