

Correlation of disease evolution with progressive inflammatory cell activation and migration in the IL-4 transgenic mouse model of atopic dermatitis
- PMID: 15654817
- PMCID: PMC1809278
- DOI: 10.1111/j.1365-2249.2004.02691.x
Correlation of disease evolution with progressive inflammatory cell activation and migration in the IL-4 transgenic mouse model of atopic dermatitis
Abstract
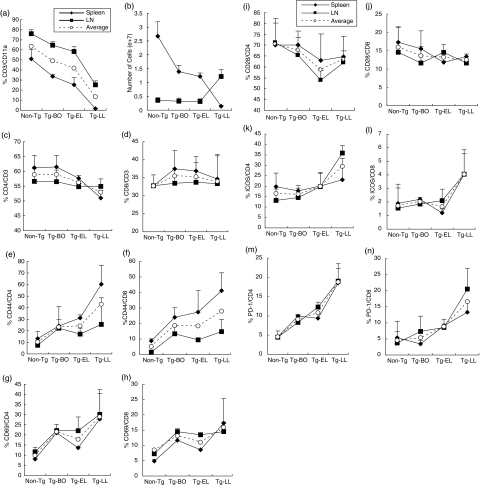
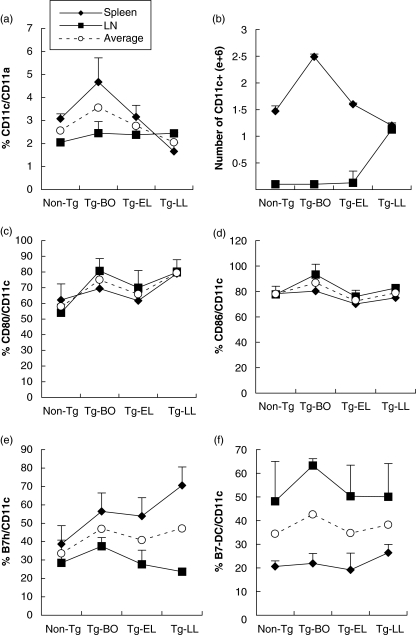
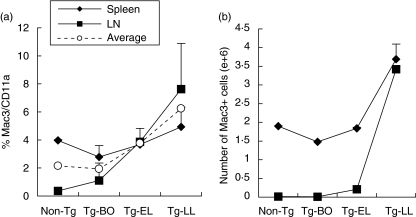
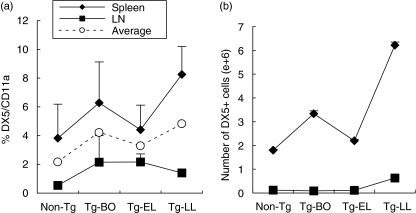
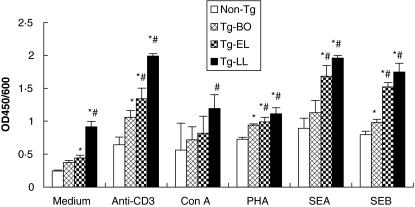
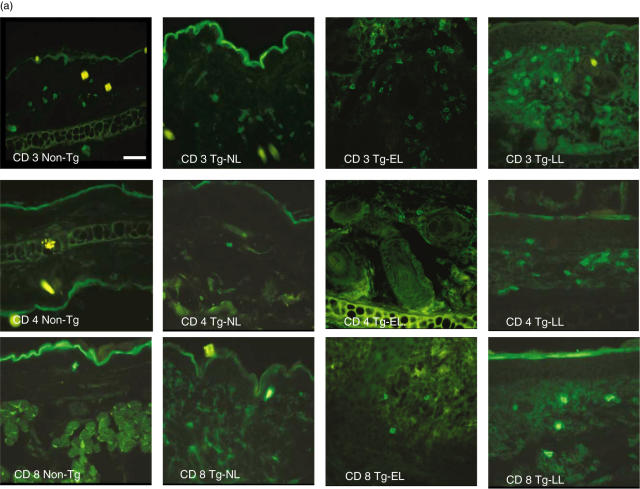
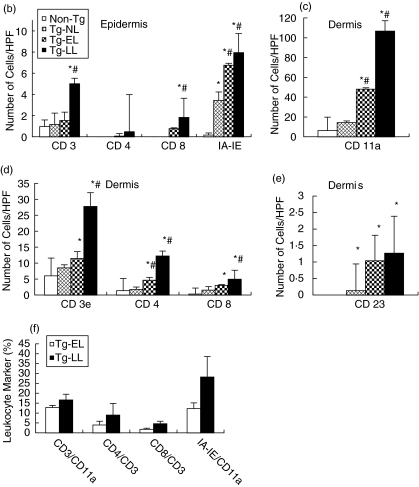
Atopic dermatitis is a chronic inflammatory skin disease characterized by inflammatory cell infiltration in the skin. In order to assess the roles of inflammatory cells in this disease, we analysed the activation status and surface markers of various leucocytes in the IL-4 transgenic mouse model of atopic dermatitis, by flow cytometry, immuofluorescence microscopy, and T cell proliferation assays. The studies were performed with a nontransgenic mouse control and transgenic mice at three disease stages: before disease onset, early skin disease, and late skin disease, so that we can delineate the immunological sequence of events. As the skin disease evolves, the skin draining lymph node cells from IL-4-Tg mice show a spontaneous proliferation and a progressively enhanced proliferative response to stimulants including anti-CD3, Con A, PHA, and Staphylococcus enterotoxins A and B. As the disease evolves, the percent of lymphoid organ T cells expressing activation molecules (CD44 and CD69) and costimulatory molecules (ICOS and PD-1) are progressively increased; the percent and total number of T cells are reduced in an incremental manner in the secondary lymphoid organs while the number of T cells infiltrating the skin increases in an incremental fashion; the total number of dendritic antigen presenting cells, macrophages, and NK cells gradually increases in the lymphoid organs. Collectively, our results suggest that there is a continued and progressive migration of activated inflammatory cells from the secondary lymphoid organs into the skin where they participate in immune responses resulting in the pathology associated with inflammation.
Figures
Similar articles
-
The disease progression in the keratin 14 IL-4-transgenic mouse model of atopic dermatitis parallels the up-regulation of B cell activation molecules, proliferation and surface and serum IgE.Clin Exp Immunol. 2005 Oct;142(1):21-30. doi: 10.1111/j.1365-2249.2005.02894.x. Clin Exp Immunol. 2005. PMID: 16178852 Free PMC article.
-
CCL27 is a critical factor for the development of atopic dermatitis in the keratin-14 IL-4 transgenic mouse model.Int Immunol. 2006 Aug;18(8):1233-42. doi: 10.1093/intimm/dxl054. Epub 2006 May 30. Int Immunol. 2006. PMID: 16735375
-
The development of atopic dermatitis is independent of Immunoglobulin E up-regulation in the K14-IL-4 SKH1 transgenic mouse model.Clin Exp Allergy. 2008 Aug;38(8):1367-80. doi: 10.1111/j.1365-2222.2008.02987.x. Epub 2008 Apr 13. Clin Exp Allergy. 2008. PMID: 18489026
-
[Cutaneous immune system].C R Seances Soc Biol Fil. 1994;188(3):207-21. C R Seances Soc Biol Fil. 1994. PMID: 7834504 Review. French.
-
ICOS: a new costimulatory ligand/receptor pair and its role in T-cell activion.Onkologie. 2004 Feb;27(1):91-5. doi: 10.1159/000075612. Onkologie. 2004. PMID: 15007255 Review.
Cited by
-
Translational Animal Models of Atopic Dermatitis for Preclinical Studies.Yale J Biol Med. 2017 Sep 25;90(3):389-402. eCollection 2017 Sep. Yale J Biol Med. 2017. PMID: 28955179 Free PMC article. Review.
-
Aberrant Wound Healing in an Epidermal Interleukin-4 Transgenic Mouse Model of Atopic Dermatitis.PLoS One. 2016 Jan 11;11(1):e0146451. doi: 10.1371/journal.pone.0146451. eCollection 2016. PLoS One. 2016. PMID: 26752054 Free PMC article.
-
VCAM-1 blockade delays disease onset, reduces disease severity and inflammatory cells in an atopic dermatitis model.Immunol Cell Biol. 2010 Mar-Apr;88(3):334-42. doi: 10.1038/icb.2009.107. Epub 2010 Jan 12. Immunol Cell Biol. 2010. PMID: 20065994 Free PMC article.
-
The disease progression in the keratin 14 IL-4-transgenic mouse model of atopic dermatitis parallels the up-regulation of B cell activation molecules, proliferation and surface and serum IgE.Clin Exp Immunol. 2005 Oct;142(1):21-30. doi: 10.1111/j.1365-2249.2005.02894.x. Clin Exp Immunol. 2005. PMID: 16178852 Free PMC article.
-
Characterization of a hapten-induced, murine model with multiple features of atopic dermatitis: structural, immunologic, and biochemical changes following single versus multiple oxazolone challenges.J Invest Dermatol. 2008 Jan;128(1):79-86. doi: 10.1038/sj.jid.5701011. Epub 2007 Aug 2. J Invest Dermatol. 2008. PMID: 17671515 Free PMC article.
References
-
- Cooper KD. Atopic dermatitis. recent trends in pathogenesis and therapy. J Invest Dermatol. 1994;102:128–37. - PubMed
-
- Leung DY, Bieber T. Atopic dermatitis. Lancet. 2003;361:151–60. - PubMed
-
- Hamid Q, Naseer T, Minshall EM, Song YL, Boguniewicz M, Leung DY. In vivo expression of IL-12 and IL-13 in atopic dermatitis. J Allergy Clin Immunol. 1996;98:225–31. - PubMed
-
- Braathen LR, Forre O, Natvig JB, Eeg-Larsen T. Predominance of T lymphocytes in the dermal infiltrate of atopic dermatitis. Br J Dermatol. 1979;100:511–9. - PubMed
Publication types
MeSH terms
Substances
Grants and funding
LinkOut - more resources
Full Text Sources
Other Literature Sources
Molecular Biology Databases
Research Materials
Miscellaneous
