

T cell repertoire in patients with stable scleroderma
- PMID: 15654834
- PMCID: PMC1809294
- DOI: 10.1111/j.1365-2249.2004.02647.x
T cell repertoire in patients with stable scleroderma
Abstract
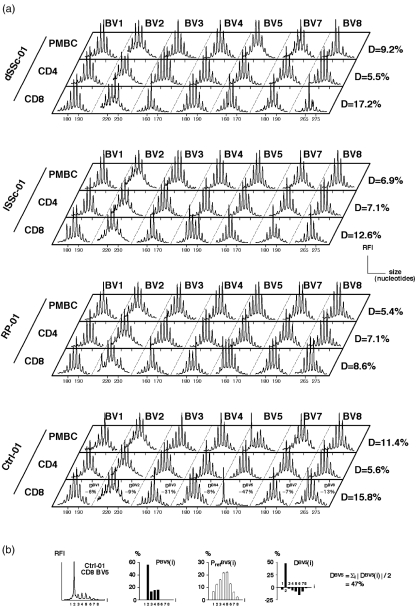
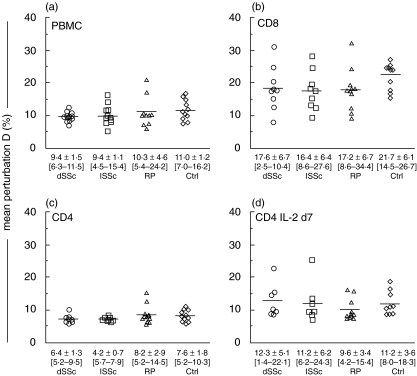
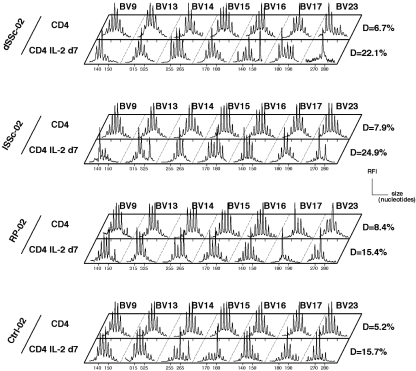
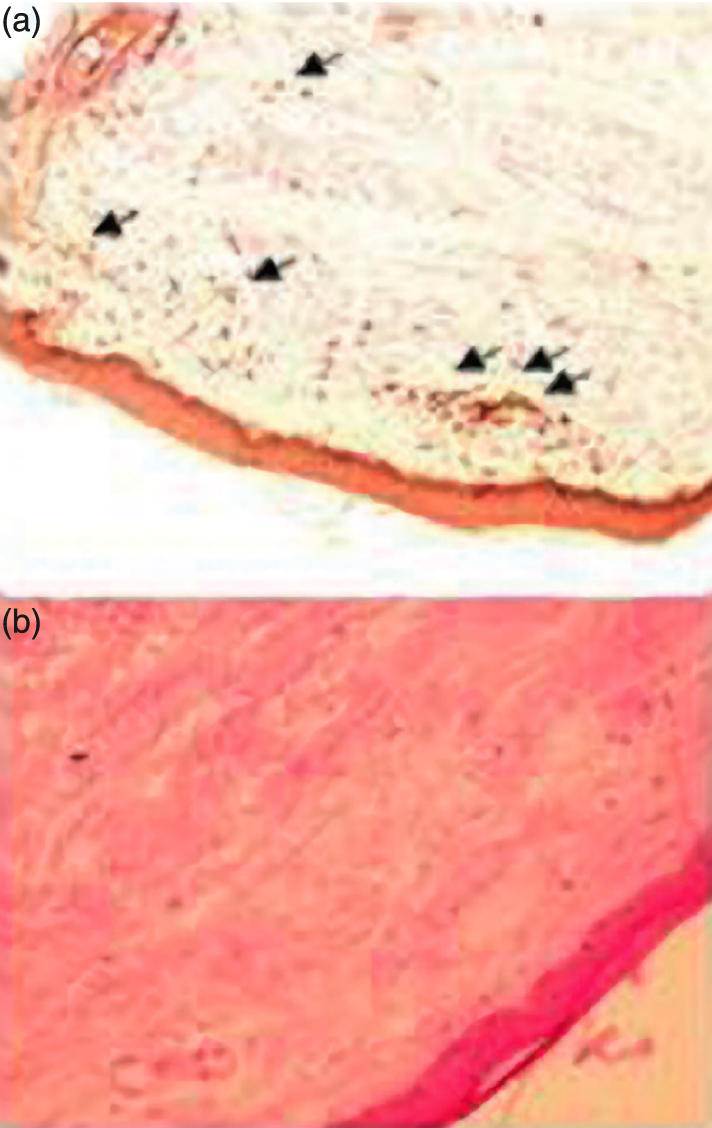
At onset of systemic sclerosis (SSc), T cells have been found to oligoclonally expand in the skin, presumably in response to auto-antigens, but the T cell repertoire has not been evaluated at a later stage. To determine whether a perpetuating immune response contributes to the pathogenesis of stable SSc, the T cell repertoire was analysed in patients with diffuse (d) or limited (l) SSc, and compared to patients with primary Raynaud's phenomenon (RP) or healthy volunteers (Ctrl). The T cell repertoire (total, CD4 or CD8 sorted blood T cells) was analysed by qualitative and quantitative immunoscope (14 BV families analysed) in 11 untreated dSSc and 11 untreated lSSc, 10 RP and 11 Ctrl. To better detect in vivo activated cells, repertoire analysis was also performed on sorted CD4 T cells after in vitro culture with IL-2. In parallel, 6 skin biopsies from SSc patients were analysed. After 7-8 years of disease evolution, SSc patients did not show detectable clonal T cell expansions in the skin, even after tentative expansion from the biopsy with IL-2. Total T cell, sorted CD4 and CD8 T cell repertoires from the blood of patients with SSc did not show significant perturbation as compared to patients with RP and Ctrl. After IL-2 culture for 7 days, blood CD4 T cells from the patients did not preferentially expand as compared to RP and Ctrl. These findings suggest that antigen-driven immune responses may play a lesser role in established SSc than at disease onset.
Figures
Similar articles
-
Current perspectives on the role of CD8+ T cells in systemic sclerosis.Immunol Lett. 2018 Mar;195:55-60. doi: 10.1016/j.imlet.2017.10.002. Epub 2017 Oct 5. Immunol Lett. 2018. PMID: 28987475 Free PMC article. Review.
-
Shared blood and muscle CD8+ T-cell expansions in inclusion body myositis.Brain. 2006 Apr;129(Pt 4):986-95. doi: 10.1093/brain/awl020. Epub 2006 Feb 2. Brain. 2006. PMID: 16455793
-
Effector CD8+ T cells in systemic sclerosis patients produce abnormally high levels of interleukin-13 associated with increased skin fibrosis.Arthritis Rheum. 2009 Apr;60(4):1119-28. doi: 10.1002/art.24432. Arthritis Rheum. 2009. PMID: 19333920
-
Presence of CD4+CD8+ double-positive T cells with very high interleukin-4 production potential in lesional skin of patients with systemic sclerosis.Arthritis Rheum. 2007 Oct;56(10):3459-67. doi: 10.1002/art.22927. Arthritis Rheum. 2007. PMID: 17907151
-
New insights into CD4(+) T cell abnormalities in systemic sclerosis.Cytokine Growth Factor Rev. 2016 Apr;28:31-6. doi: 10.1016/j.cytogfr.2015.12.002. Epub 2015 Dec 18. Cytokine Growth Factor Rev. 2016. PMID: 26724976 Review.
Cited by
-
Current perspectives on the role of CD8+ T cells in systemic sclerosis.Immunol Lett. 2018 Mar;195:55-60. doi: 10.1016/j.imlet.2017.10.002. Epub 2017 Oct 5. Immunol Lett. 2018. PMID: 28987475 Free PMC article. Review.
-
Peripheral T lymphocytes from patients with early systemic sclerosis co-cultured with autologous fibroblasts undergo an oligoclonal expansion similar to that occurring in the skin.Clin Exp Immunol. 2006 Apr;144(1):169-76. doi: 10.1111/j.1365-2249.2006.03041.x. Clin Exp Immunol. 2006. PMID: 16542379 Free PMC article.
-
Characterising the autoantibody repertoire in systemic sclerosis following myeloablative haematopoietic stem cell transplantation.Ann Rheum Dis. 2023 May;82(5):670-680. doi: 10.1136/ard-2021-221926. Epub 2023 Jan 18. Ann Rheum Dis. 2023. PMID: 36653124 Free PMC article.
-
A Paradigmatic Interplay between Human Cytomegalovirus and Host Immune System: Possible Involvement of Viral Antigen-Driven CD8+ T Cell Responses in Systemic Sclerosis.Viruses. 2018 Sep 18;10(9):508. doi: 10.3390/v10090508. Viruses. 2018. PMID: 30231575 Free PMC article.
-
Subset-specific alterations in frequencies and functional signatures of γδ T cells in systemic sclerosis patients.Inflamm Res. 2016 Dec;65(12):985-994. doi: 10.1007/s00011-016-0982-6. Epub 2016 Aug 30. Inflamm Res. 2016. PMID: 27576328
References
-
- Prescott RJ, Freemont AJ, Jones CJ, Hoyland J, Fielding P. Sequential dermal microvascular and perivascular changes in the development of scleroderma. J Pathol. 1992;166:255–63. - PubMed
-
- Sakkas LI, Xu B, Artlett CM, Lu S, Jimenez SA, Platsoucas CD. Oligoclonal T cell expansion in the skin of patients with systemic sclerosis. J Immunol. 2002;168:3649–59. - PubMed
-
- Wooley PH, Sud S, Langendorfer A, et al. T cells infiltrating the skin of Tsk2 scleroderma-like mice exhibit T cell receptor bias. Autoimmunity. 1998;27:91–8. - PubMed
-
- Mayo MJ, Jenkins RN, Combes B, Lipsky PE. Association of clonally expanded T cells with the syndrome of primary biliary cirrhosis and limited scleroderma. Hepatology. 1999;29:1635–42. - PubMed
-
- Yurovsky VV, Wigley FM, Wise RA, White B. Skewing of the CD8+ T-cell repertoire in the lungs of patients with systemic sclerosis. Hum Immunol. 1996;48:84–97. - PubMed
Publication types
MeSH terms
Substances
LinkOut - more resources
Full Text Sources
Medical
Research Materials
