. 2005 Feb;144(3):338-48.
doi: 10.1038/sj.bjp.0706053.

Gastrin promotes human colon cancer cell growth via CCK-2 receptor-mediated cyclooxygenase-2 induction and prostaglandin E2 production

Affiliations

Gastrin promotes human colon cancer cell growth via CCK-2 receptor-mediated cyclooxygenase-2 induction and prostaglandin E2 production

Rocchina Colucci et al. Br J Pharmacol. 2005 Feb.

Abstract

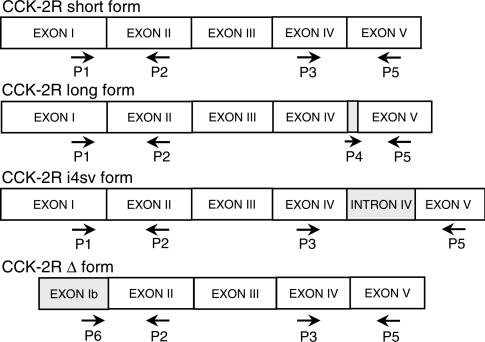
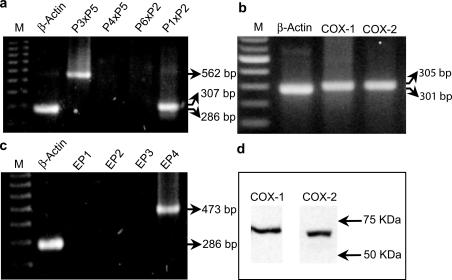
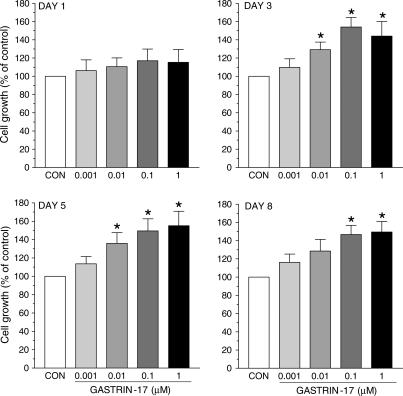
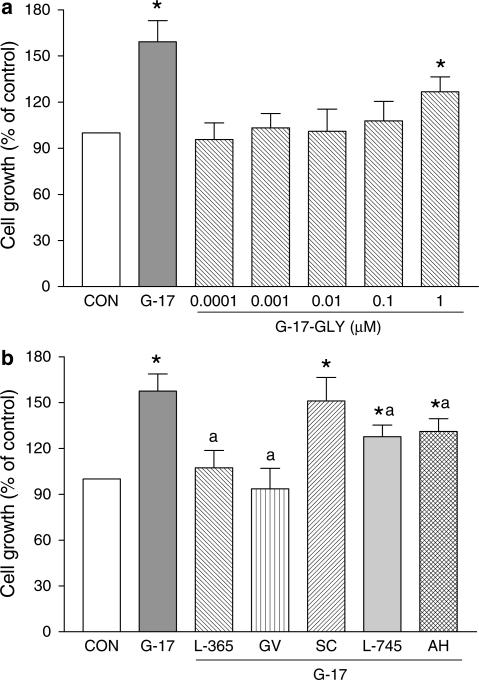
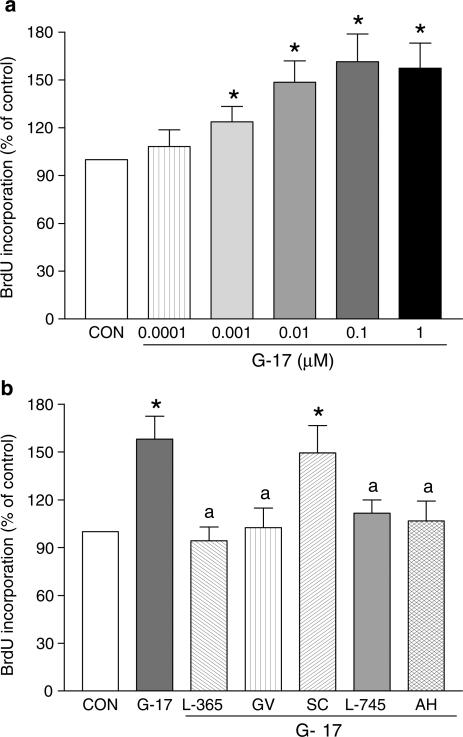
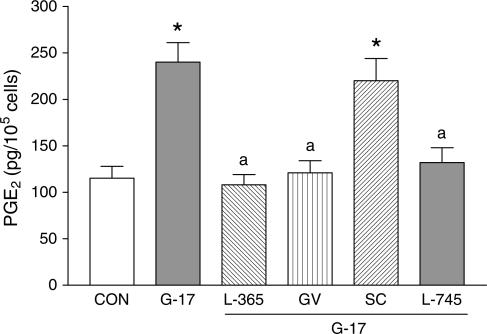
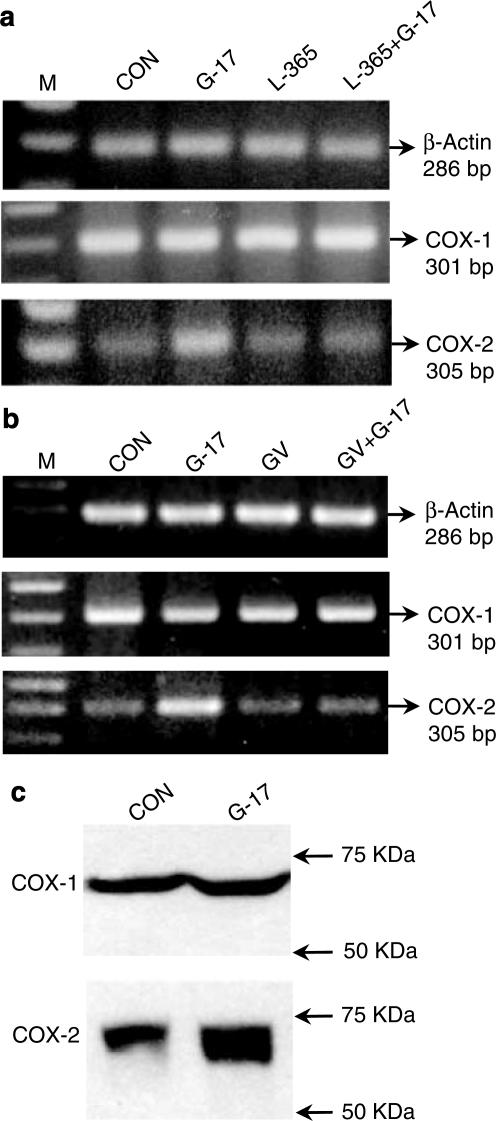
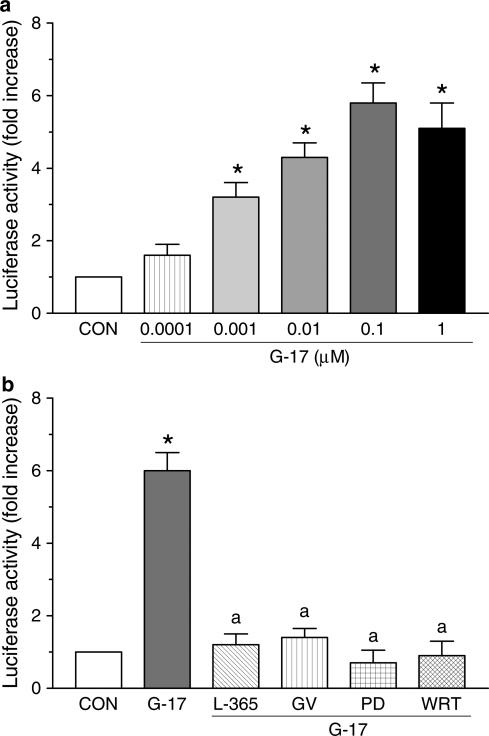
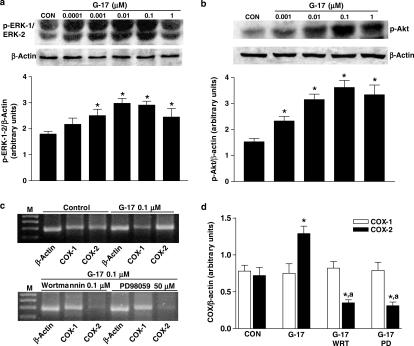
The present study investigates the effects of gastrin-17 on human colon cancer HT-29 cells to examine whether gastrin receptor (CCK-2), cyclooxygenase (COX-1, COX-2) isoforms and prostaglandin receptor pathways interact to control cell growth. Reverse transcription (RT)-polymerase chain reaction (PCR) analysis demonstrated that HT-29 cells are endowed with the naive expression of CCK-2 receptor (short splice variant), COX-1, COX-2 and prostaglandin EP(4) receptor, but not gastrin. Gastrin-17 significantly promoted cell growth and DNA synthesis. Both these stimulating effects were abolished by L-365,260 or GV150013 (CCK-2 receptor antagonists), but were unaffected by SC-560 (COX-1 inhibitor). L-745,337 (COX-2 inhibitor) or AH-23848B (EP(4) receptor antagonist) partly reversed gastrin-17-induced cell growth, while they fully antagonized the enhancing action on DNA synthesis. HT-29 cells responded to gastrin-17 with a significant increase in prostaglandin E(2) release. This enhancing effect was completely counteracted by L-365,260, GV150013 or L-745,337, while it was insensitive to cell incubation with SC-560. Exposure of HT-29 cells to gastrin-17 was followed by an increased phosphorylation of both extracellular regulated kinases (ERK-1/ERK-2) and Akt. Moreover, gastrin-17 enhanced the transcriptional activity of COX-2 gene promoter and stimulated COX-2 expression. These latter effects were antagonized by L-365,260 or GV150013, and could be blocked also by PD98059 (inhibitor of ERK-1/ERK-2 phosphorylation) or wortmannin (inhibitor of phosphatidylinositol 3-kinase). Analogously, gastrin-17-induced prostaglandin E(2) release was prevented by PD98059 or wortmannin. The present results suggest that (a) in human colon cancer cells endowed with CCK-2 receptors, gastrin-17 is able to enhance the transcriptional activity of COX-2 gene through the activation of ERK-1/ERK-2- and phosphatidylinositol 3-kinase/Akt-dependent pathways; (b) these stimulant actions lead to downstream increments of COX-2 expression, followed by prostaglandin E(2) production and EP(4) receptor activation; (c) the recruitment of COX-2/prostaglandin pathways contributes to the growth-promoting actions exerted by gastrin-17.


Figures

Figure 1
Figure 1
Schematic representation of oligonucleotide primers designed for RT–PCR analysis of mRNA encoding the splice variants of human CCK-2 receptor (CCK-2R). With respect to the short form, the long form includes a 15-bp nucleotide cassette of intron IV (Song et al., 1993), whereas the i4sv form retains the whole sequence of intron IV (Hellmich et al., 2000). In the Δ variant, exon I is replaced with a novel exon named exon Ib (Miyake, 1995). Different primer combinations and size of PCR products allowed to detect the expression of specific splice variants in accordance with the following criteria: short form, P1xP2 (307 bp) and P3xP5 (562 bp); long form, P1xP2 (307 bp) and P4xP5 (473 bp); i4sv form, P1xP2 (307 bp), P3xP5 (769 bp) and P4xP5 (668); Δ form, P6xP2 (280 bp) and P3xP5 (562 bp). Nucleotide sequences of the above primers are displayed in Table 1.
Figure 2
Figure 2
RT–PCR analysis of mRNA encoding CCK-2 receptor splice variants (a), cyclooxygenase isoforms (COX-1, COX-2) (b) and EP receptor subtypes (EP1, EP2, EP3, EP4) (c) in HT-29 cells. In panel (a), different combinations of primers P1, P2, P3, P4, P5, P6 and respective size of PCR products allowed to detect the expression of specific splice variants of CCK-2 receptor mRNA, in accordance with criteria illustrated in Figure 1. M=size markers. (d) Western blot analysis of protein expression of cyclooxygenase isoforms in HT-29 cells.
Figure 3
Figure 3
Growth of HT-29 cells following their exposure to increasing concentrations of gastrin-17 (0.001–1 μM) for 1, 3, 5 or 8 days. Each column represents the mean of five to six experiments±s.e.m. (vertical bars). Significant difference from control values (CON): *P<0.05.
Figure 4
Figure 4
Growth of HT-29 cells. (a) Effects of gastrin-17 (G-17, 0.1 μM) or increasing concentrations of glycine extended gastrin-17 (G-17-GLY, 0.0001–1 μM). (b) Effects of G-17 (0.1 μM), either alone or in combination with L-365,260 (L-365, 1 μM), GV150013 (GV, 0.1 μM), SC-560 (SC, 0.1 μM), L-745,337 (L-745, 0.1 μM) or AH-23848B (AH, 1 μM). Each column represents the mean of five to seven experiments±s.e.m. (vertical bars). Significant difference from the respective control values (CON): *P<0.05; significant difference from the respective values obtained in the presence of G-17 alone: aP<0.05.
Figure 5
Figure 5
Evaluation of 5-bromo-2′-deoxyuridine (BrdU) incorporation in HT-29 cells. (a) Effects of increasing concentrations of gastrin-17 (G-17, 0.0001–1 μM). (b) Effects of G-17 (0.1 μM), either alone or in combination with L-365,260 (L-365, 1 μM), GV150013 (GV, 0.1 μM), SC-560 (SC, 0.1 μM), L-745,337 (L-745, 0.1 μM) or AH-23848B (AH, 1 μM). Each column represents the mean of four to five experiments±s.e.m. (vertical bars). Significant difference from the respective control values (CON): *P<0.05; significant difference from the respective values obtained in the presence of G-17 alone: aP<0.05.
Figure 6
Figure 6
PGE2 release from HT-29 cells following their incubation with gastrin-17 (G-17, 0.1 μM), either alone or in combination with L-365,260 (L-365, 1 μM), GV150013 (GV, 0.1 μM), SC-560 (SC, 0.1 μM) or L-745,337 (L-745, 0.1 μM). Each column represents the mean of six experiments±s.e.m. (vertical bars). Significant difference from the respective control values (CON): *P<0.05; significant difference from the respective values obtained in the presence of G-17 alone: aP<0.05.
Figure 7
Figure 7
(a, b) RT–PCR analysis of mRNA expression for cyclooxygenase isoforms (COX-1, COX-2) in HT-29 cells. (a) Effects of gastrin-17 (G-17, 0.1 μM), L-365,260 (L-365, 1 μM) or G-17 plus L-365,260. (b) Effects of G-17 (0.1 μM), GV150013 (GV, 0.1 μM) or G-17 plus GV150013. M=size markers. (c) Western blot analysis showing the effects of G-17 (0.1 μM) on protein expression of cyclooxygenase isoforms. CON=control.
Figure 8
Figure 8
Transcriptional activity of COX-2 promoter in HT-29 cells transiently transfected with a COX-2-promoter-Luc plasmid. (a) Effects of increasing concentrations of gastrin-17 (G-17, 0.0001-1 μM) on luciferase activity. (b) Effects of G-17 (0.1 μM), either alone or in combination with L-365,260 (L-365, 1 μM), GV150013 (GV, 0.1 μM), PD98059 (PD, 50 μM) or wortmannin (WRT, 0.1 μM), on luciferase activity. Each column represents the mean of five to six experiments±s.e.m. (vertical bars). Significant difference from the respective control values (CON): *P<0.05; significant difference from the respective value obtained in the presence of G-17 alone: aP<0.05.
Figure 9
Figure 9
(a, b) Western blot analysis showing the effects of increasing concentrations of gastrin-17 (G-17, from 0.0001 or 0.001 to 1 μM) on phosphorylation of ERK-1/ERK-2 (p-ERK-1/ERK-2) or Akt (p-Akt) in HT-29 cells. Column graphs refer to the densitometric analysis of p-ERK-1/ERK-2 or p-Akt bands normalized to the expression of β-actin. Each column represents the mean of four experiments±s.e.m. (vertical bars). Significant difference from the respective control values (CON): *P<0.05. (c, d) RT–PCR analysis showing the effects of G-17 (0.1 μM), either alone or in combination with wortmannin (WRT, 0.1 μM) or PD98059 (PD, 50 μM), on mRNA expression of cyclooxygenase isoforms (COX-1, COX-2) in HT-29 cells. M=size markers. Column graphs refer to the densitometric analysis of COX-1 or COX-2 cDNA bands normalized to the expression of β-actin. Each column represents the mean of four experiments±s.e.m. (vertical bars). Significant difference from the respective control values (CON): *P<0.05; significant difference from the respective values obtained in the presence of G-17 alone: aP<0.05.

References

    1. BELLEY A., CHADEE K. Prostaglandin E2 stimulates rat and human colonic mucin exocytosis via the EP4 receptor. Gastroenterology. 1999;117:1352–1362. - PubMed
    1. DI POPOLO A., MEMOLI A., APICELLA A., TUCCILLO C., DI PALMA A., RICCHI P., ACQUAVIVA A.M., ZARRILLI R. IGF-II/IGF-I receptor pathway up-regulates COX-2 mRNA expression and PGE2 synthesis in Caco-2 human colon carcinoma cells. Oncogene. 2000;19:5517–5524. - PubMed
    1. DOCKRAY G.J., VARRO A., DIMALINE R., WANG T. The gastrins: their production and biological activities. Annu. Rev. Physiol. 2001;63:119–139. - PubMed
    1. DU BOIS R.N., ABRAMSON S.B., CROFFORD L., GUPTA R.A., SIMON L.S., VAN DE PUTTE L.B., LIPSKY P.E. Cyclooxygenase in biology and disease. FASEB J. 1998;12:1063–1073. - PubMed
    1. GUO Y.-S., CHENG J.-Z., JIN G.-F., GUTKIND J.S., HELLMICH M.R., TOWNSEND M.T. Gastrin stimulates cyclooxygenase-2 expression in intestinal epithelial cells through multiple signaling pathways. J. Biol. Chem. 2002;277:48755–48763. - PubMed

MeSH terms