

A form of DISC1 enriched in nucleus: altered subcellular distribution in orbitofrontal cortex in psychosis and substance/alcohol abuse
- PMID: 15657124
- PMCID: PMC545838
- DOI: 10.1073/pnas.0406543102
A form of DISC1 enriched in nucleus: altered subcellular distribution in orbitofrontal cortex in psychosis and substance/alcohol abuse
Abstract
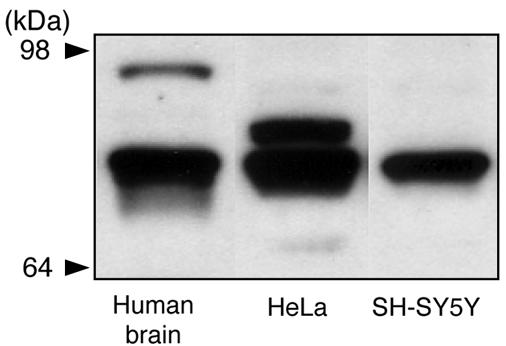
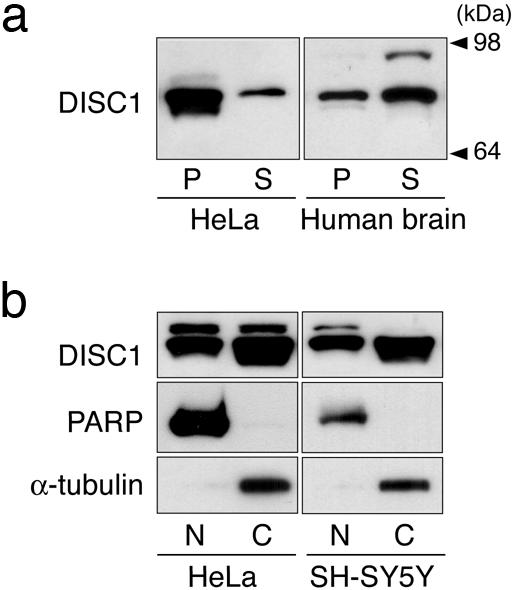
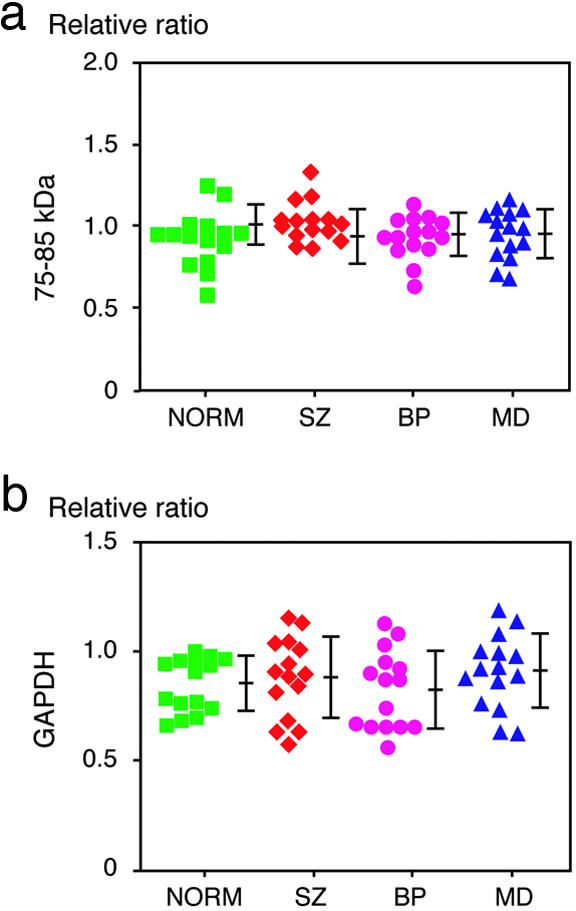
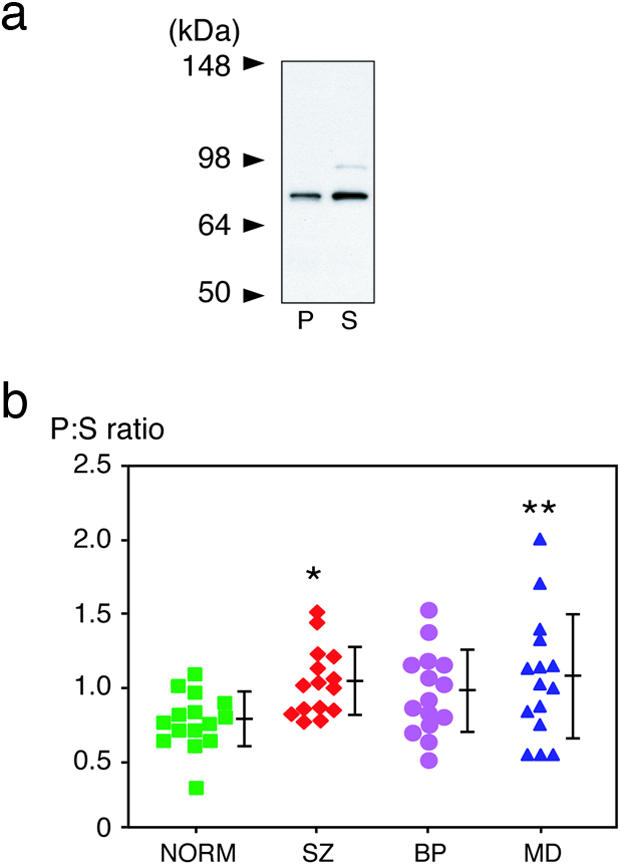
Disrupted-In-Schizophrenia 1 (DISC1) was identified as the sole gene whose ORF is truncated and cosegregates with major mental illnesses in a Scottish family. DISC1 has also been suggested, by association and linkage studies, to be a susceptibility gene for schizophrenia (SZ) in independent populations. However, no analysis of DISC1 protein in human brains, especially those of patients with SZ, has yet been conducted. Here we performed a biochemical analysis of DISC1 protein in a well characterized set of autopsied brains, including brains of patients with SZ, bipolar disorder, and major depression (MD), as well as normal control brains. We identified an isoform of DISC1 by using MS and demonstrated that it is enriched in the nucleus of HeLa cells. In the orbitofrontal cortex, the subcellular distribution of this DISC1 isoform, assessed by the nuclear to cytoplasmic ratio in the immunoreactivity of the isoform, is significantly changed in brains from patients with SZ and MD. This altered distribution is also observed in those subjects with substance and alcohol abuse. The changes in MD brains are significantly influenced by substance/alcohol abuse as well as postmortem interval; however, the alteration in SZ brains is free from brain-associated confounding factors, although an interaction with substance/alcohol abuse cannot be completely ruled out. These results suggest that DISC1 may be implicated in psychiatric conditions in other populations than the unique Scottish family.
Figures
Similar articles
-
Disrupted-in-schizophrenia-1 (DISC1): a key susceptibility factor for major mental illnesses.Ann N Y Acad Sci. 2006 Nov;1086:126-33. doi: 10.1196/annals.1377.018. Ann N Y Acad Sci. 2006. PMID: 17185511 Review.
-
Altered subcellular distribution of the 75-kDa DISC1 isoform, cAMP accumulation, and decreased neuronal migration in schizophrenia and bipolar disorder: implications for neurodevelopment.CNS Neurosci Ther. 2015 May;21(5):446-53. doi: 10.1111/cns.12377. Epub 2015 Jan 24. CNS Neurosci Ther. 2015. PMID: 25620115 Free PMC article.
-
DNA methylation/demethylation network expression in psychotic patients with a history of alcohol abuse.Alcohol Clin Exp Res. 2013 Mar;37(3):417-24. doi: 10.1111/j.1530-0277.2012.01947.x. Epub 2012 Sep 7. Alcohol Clin Exp Res. 2013. PMID: 22958170 Clinical Trial.
-
Subcellular targeting of DISC1 is dependent on a domain independent from the Nudel binding site.Mol Cell Neurosci. 2005 Apr;28(4):613-24. doi: 10.1016/j.mcn.2004.11.003. Mol Cell Neurosci. 2005. PMID: 15797709
-
A review of Disrupted-In-Schizophrenia-1 (DISC1): neurodevelopment, cognition, and mental conditions.Biol Psychiatry. 2006 Jun 15;59(12):1189-97. doi: 10.1016/j.biopsych.2006.03.065. Biol Psychiatry. 2006. PMID: 16797264 Review.
Cited by
-
Interactions of human truncated DISC1 proteins: implications for schizophrenia.Transl Psychiatry. 2011 Aug 16;1(8):e30. doi: 10.1038/tp.2011.31. Transl Psychiatry. 2011. PMID: 22832604 Free PMC article.
-
Neurodevelopmental mechanisms of schizophrenia: understanding disturbed postnatal brain maturation through neuregulin-1-ErbB4 and DISC1.Trends Neurosci. 2009 Sep;32(9):485-95. doi: 10.1016/j.tins.2009.05.007. Epub 2009 Aug 26. Trends Neurosci. 2009. PMID: 19712980 Free PMC article. Review.
-
Schizophrenia in translation: disrupted in schizophrenia (DISC1): integrating clinical and basic findings.Schizophr Bull. 2007 Jan;33(1):11-5. doi: 10.1093/schbul/sbl063. Epub 2006 Nov 30. Schizophr Bull. 2007. PMID: 17138582 Free PMC article. Review.
-
Postmortem diagnosis and toxicological validation of illicit substance use.Addict Biol. 2008 Mar;13(1):105-17. doi: 10.1111/j.1369-1600.2007.00085.x. Epub 2008 Jan 14. Addict Biol. 2008. PMID: 18201295 Free PMC article.
-
The miR-124-AMPAR pathway connects polygenic risks with behavioral changes shared between schizophrenia and bipolar disorder.Neuron. 2023 Jan 18;111(2):220-235.e9. doi: 10.1016/j.neuron.2022.10.031. Epub 2022 Nov 14. Neuron. 2023. PMID: 36379214 Free PMC article.
References
-
- Sawa, A. & Snyder, S. H. (2002) Science 296, 692–695. - PubMed
-
- Harrison, P. J. & Weinberger, D. R. (2005) Mol. Psychiatry 10, 40–68. - PubMed
-
- St. Clair, D., Blackwood, D., Muir, W., Carothers, A., Walker, M., Spowart, G., Gosden, C. & Evans, H. J. (1990) Lancet 336, 13–16. - PubMed
-
- Millar, J. K., Wilson-Annan, J. C., Anderson, S., Christie, S., Taylor, M. S., Semple, C. A., Devon, R. S., Clair, D. M., Muir, W. J., Blackwood, D. H., et al. (2000) Hum. Mol. Genet. 9, 1415–1423. - PubMed
Publication types
MeSH terms
Substances
Grants and funding
LinkOut - more resources
Full Text Sources
Other Literature Sources
Medical
Molecular Biology Databases
