. 2005 Jan 17;201(2):221-31.
doi: 10.1084/jem.20041535.

Dynamic regulation of PU.1 expression in multipotent hematopoietic progenitors

Affiliations

Dynamic regulation of PU.1 expression in multipotent hematopoietic progenitors

Stephen L Nutt et al. J Exp Med. .

Abstract

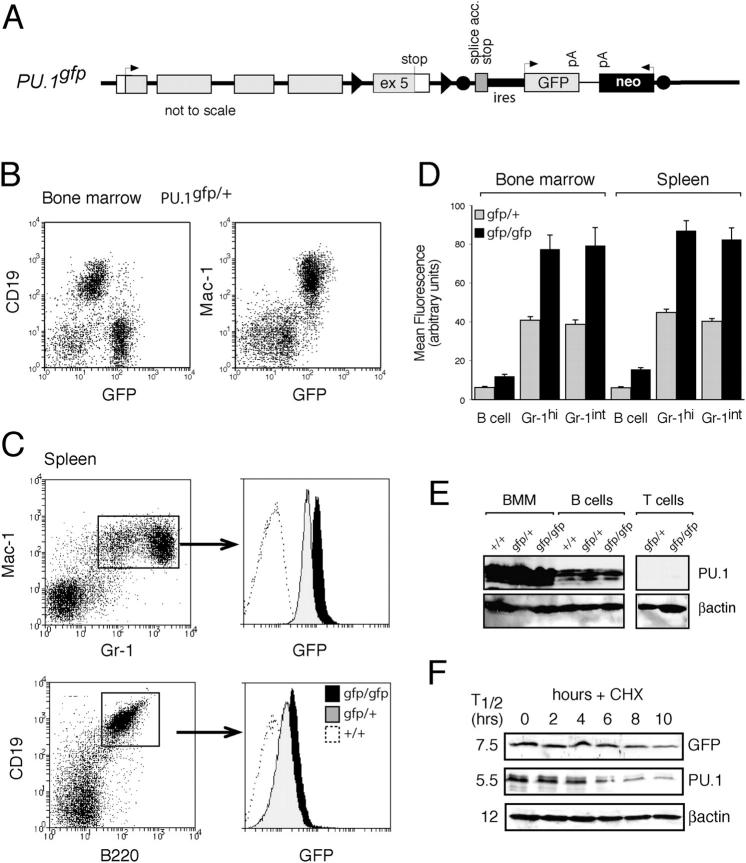
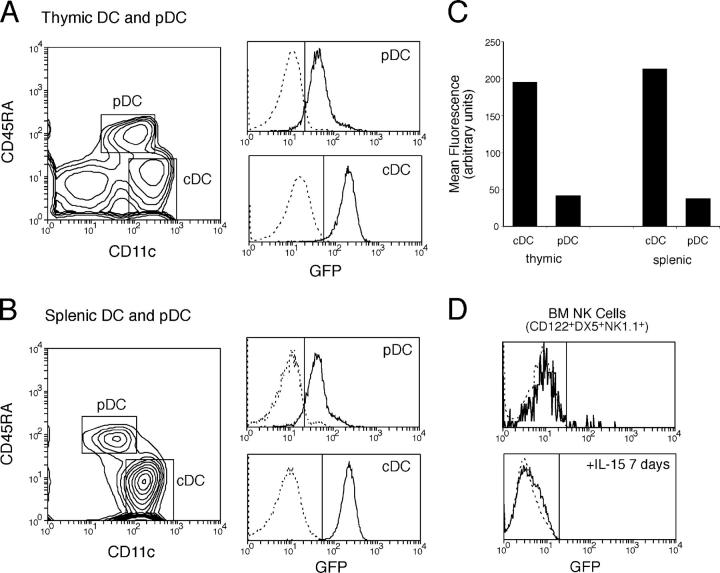
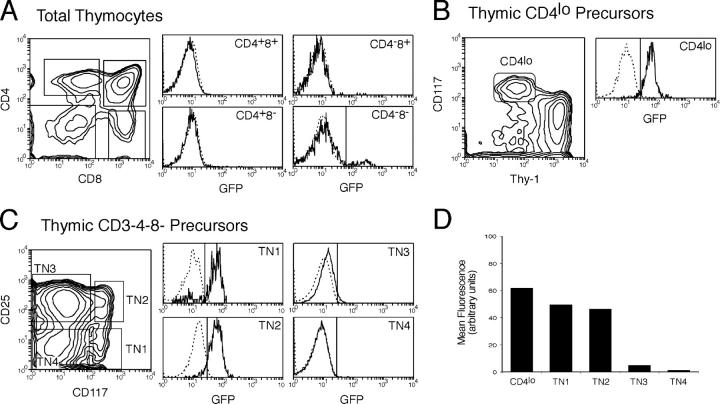
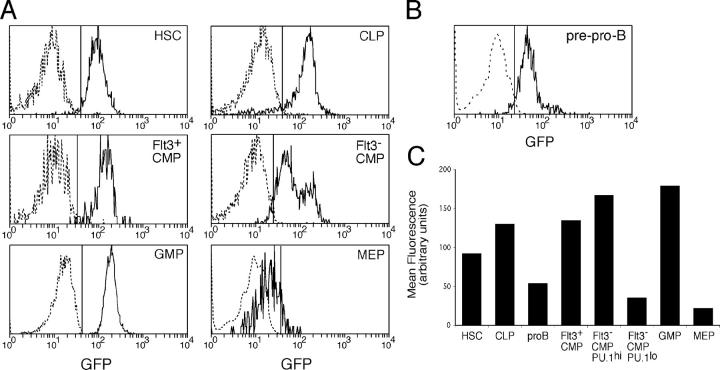
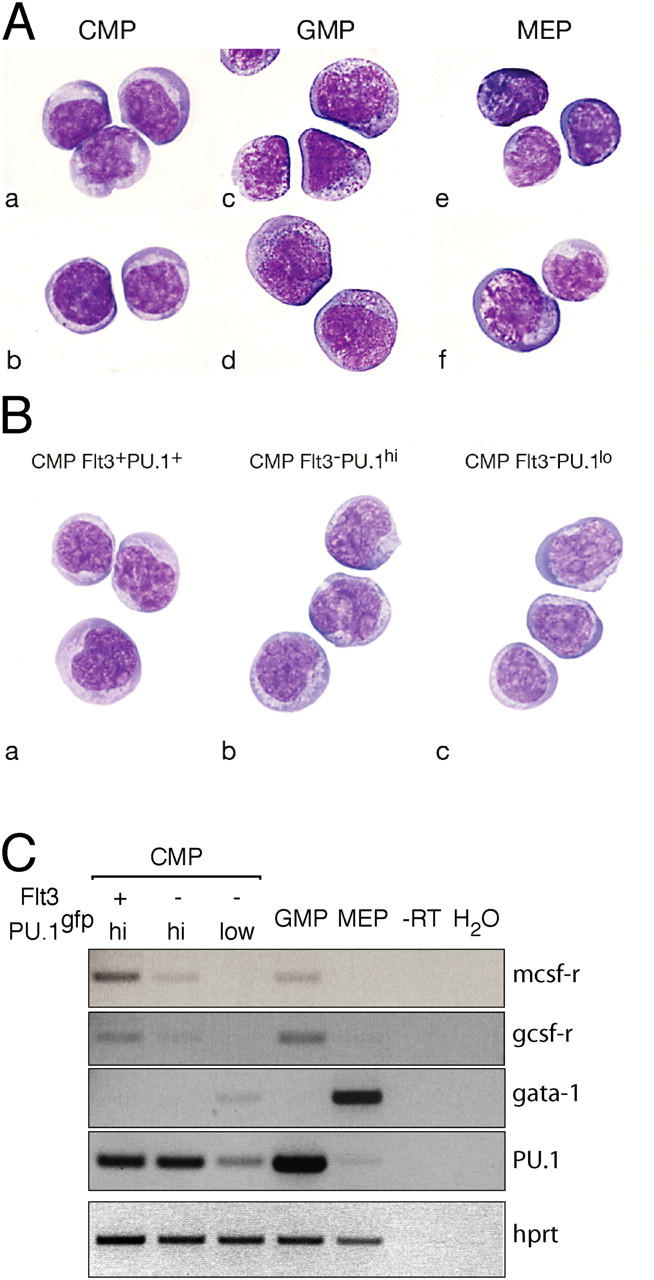
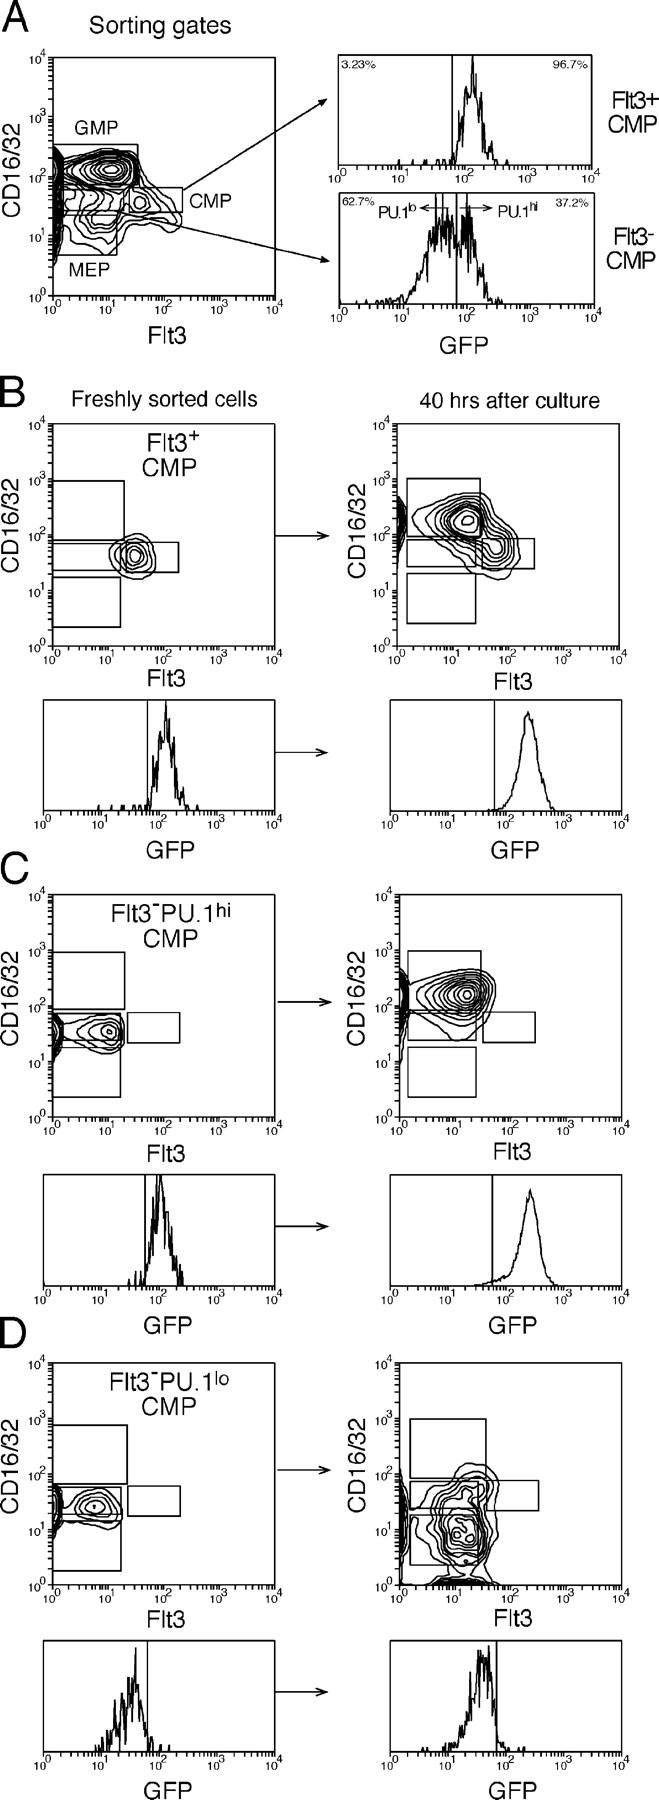
PU.1 is an Ets family transcription factor that is essential for fetal liver hematopoiesis. We have generated a PU.1(gfp) reporter strain that allowed us to examine the expression of PU.1 in all hematopoietic cell lineages and their early progenitors. Within the bone marrow progenitor compartment, PU.1 is highly expressed in the hematopoietic stem cell, the common lymphoid progenitor, and a proportion of common myeloid progenitors (CMPs). Based on Flt3 and PU.1 expression, the CMP could be divided into three subpopulations, Flt3(+) PU.1(hi), Flt3(-) PU.1(hi), and Flt3(-) PU.1(lo) CMPs. Colony-forming assays and in vivo lineage reconstitution demonstrated that the Flt3(+) PU.1(hi) and Flt3(-) PU.1(hi) CMPs were efficient precursors for granulocyte/macrophage progenitors (GMPs), whereas the Flt3(-) PU.1(lo) CMPs were highly enriched for committed megakaryocyte/erythrocyte progenitors (MEPs). CMPs have been shown to rapidly differentiate into GMPs and MEPs in vitro. Interestingly, short-term culture revealed that the Flt3(+) PU.1(hi) and Flt3(-) PU.1(hi) CMPs rapidly became CD16/32(high) (reminiscent of GMPs) in culture, whereas the Flt3(-) PU.1(lo) CMPs were the immediate precursors of the MEP. Thus, down-regulation of PU.1 expression in the CMP is the first molecularly identified event associated with the restriction of differentiation to erythroid and megakaryocyte lineages.


Figures

Figure 1.
Figure 1.
Generation and validation of a PU.1gfp reporter strain. (A) The targeted PU.1 gfp locus is shown with the exons indicated as boxes and the introns as black lines. Coding regions are in gray and nontranslated regions are white. Arrows indicate direction of translation from initial methionine. pA, polyadenylation signal sequence; circles, frt sites; triangles, loxP sites; stop, stop codon; splice acc., splice acceptor. The targeted allele translates full-length PU.1 and GFP from the same mRNA transcript. (B) GFP expression in PU.1 gfp/+ BM. Cells were stained for CD19 (B cells) and Mac-1 (myeloid cells). (C) GFP expression in B cells and macrophage/granulocytes of adult spleen of +/+, PU.1 gfp/+, and PU.1 gfp/gfp mice. (D) Quantitation of mean fluorescence of B cells (CD19+ B220+), granulocytes (Mac-1+ Gr.1high), and immature myeloid cells (Mac-1+ Gr-1–intermediate [Gr.1int]) from BM and spleen. n = 4–10 mice per group. Relative mean fluorescence was determined relative to identically gated C57BL/6 cells and is shown in arbitrary units. (E) Western blotting for PU.1 in BM Mac-1+/Gr.1+ myeloid cells (BMM), CD19+ B220+ spleen B cells, and CD4+ T lymphocytes. β actin was a loading control. (F) Determination of PU.1 and GFP stability in splenocytes. Cells were cultured for up to 12 h in the protein synthesis inhibitor cyclohexamide, and equivalent cell numbers were assayed for PU.1, GFP, and β actin levels by Western blotting. The calculated half-life of the proteins is indicated (left).
Figure 2.
Figure 2.
PU.1gfp expression in DCs and NK cells. (A) The thymic and (B) splenic cDCs and pDCs were prepared from the PU.1 gfp/gfp mice. The GFP fluorescent intensities of cDCs and pDCs were analyzed on gated cDC (CD11chi CD45RA) and pDC (CD11cint CD45RA+) populations and presented as histograms. (C) PU.1 expression by cDCs and pDCs were quantified as the mean fluorescence of GFP. (D) PU.1gfp expression in mature NK cells isolated from BM (CD122+ DX5+ NK1.1+). NK cells were also generated from BM cultures in the presence of IL-15 for 7 d and assessed for GFP. The solid lines represent the PU.1gfp levels and the dotted lines represent the background from wild-type mice.
Figure 3.
Figure 3.
PU.1gfp expression during T cell development. (A) Total thymocytes from PU.1 gfp/gfp mice were analyzed for CD4, CD8, and GFP. The PU.1gfp expression by each major thymocyte populations was analyzed on gated cells and is presented as histograms. (B) PU.1gfp expression by the earliest intrathymic precursor population (CD4lo, CD38 Thy-1lo CD117+). (C) CD348 (TN) thymic precursor populations were isolated and PU.1gfp expression by each TN precursor population was analyzed on gated cells. (D) The level of PU.1 expression was quantified as the mean fluorescence of GFP by each thymic precursor population. The solid lines represent the PU.1gfp and the dotted lines represent the background of each cell population in +/+ mice.
Figure 4.
Figure 4.
PU.1gfp expression by BM HSCs and multipotent progenitors. (A and B) The BM HSCs and indicated hematopoietic progenitor populations from PU.1 gfp/gfp and wild-type mice were isolated as described in Materials and methods. The GFP fluorescence intensity of each progenitor population is presented as histograms. The solid lines are from PU.1 gfp/gfp cells and the dotted lines from +/+ mice. (C) Quantitation of the mean fluorescence of GFP expression by each cell population.
Figure 5.
Figure 5.
Morphology and differential gene expression by the BM progenitor populations. (A) Morphology of unseparated CMP (a and b), GMP (c and d), and MEP (e and f) populations. (B) Morphology of the indicated three CMP subpopulations. BM progenitor populations were purified by flow cytometric cell sorting and cytocentrifuged onto a glass slide and stained with May-Grunwald-Giemsa solution. (C) RT-PCR for the expression of the indicated genes was performed with the cDNA prepared from each progenitor populations. hprt was used as a control for cDNA input.
Figure 6.
Figure 6.
In vitro differentiation of the CMP subpopulations. The three CMP populations, defined as CD16/32int Flt3+, CD16/32int Flt3 PU.1hi, and CD16/32int Flt3 PU.1lo, were sorted using the gates shown in A and cultured on S17 stromal cells in the presence of SCF for 40 h. The levels of the PU.1gfp, CD16/32, and Flt3 on freshly isolated precursor populations are shown. Flt3+ CMP (B), Flt3 PU.1hi CMP (C), and Flt3 PU.1lo CMP (D) are shown in the left panels. The phenotypes of the progeny of each precursor population after 40 h in culture are shown in the right panels. The results shown are representative of three experiments.

Similar articles

Cited by

References

    1. Kondo, M., A.J. Wagers, M.G. Manz, S.S. Prohaska, D.C. Scherer, G.F. Beilhack, J.A. Shizuru, and I.L. Weissman. 2003. Biology of hematopoietic stem cells and progenitors: implications for clinical application. Annu. Rev. Immunol. 21:759–806. - PubMed
    1. Akashi, K., D. Traver, T. Miyamoto, and I.L. Weissman. 2000. A clonogenic common myeloid progenitor that gives rise to all myeloid lineages. Nature. 404:193–197. - PubMed
    1. Cantor, A.B., and S.H. Orkin. 2002. Transcriptional regulation of erythropoiesis: an affair involving multiple partners. Oncogene. 21:3368–3376. - PubMed
    1. Warren, L.A., and E.V. Rothenberg. 2003. Regulatory coding of lymphoid lineage choice by hematopoietic transcription factors. Curr. Opin. Immunol. 15:166–175. - PubMed
    1. Scott, E.W., M.C. Simon, J. Anastasi, and H. Singh. 1994. Requirement of transcription factor PU.1 in the development of multiple hematopoietic lineages. Science. 265:1573–1577. - PubMed

Publication types

MeSH terms