. 2005 Feb;125(2):197-211.
doi: 10.1085/jgp.200409161. Epub 2005 Jan 18.

Ca(2+)- and volume-sensitive chloride currents are differentially regulated by agonists and store-operated Ca2+ entry

Affiliations

Ca(2+)- and volume-sensitive chloride currents are differentially regulated by agonists and store-operated Ca2+ entry

Alexander Zholos et al. J Gen Physiol. 2005 Feb.

Abstract

Using patch-clamp and calcium imaging techniques, we characterized the effects of ATP and histamine on human keratinocytes. In the HaCaT cell line, both receptor agonists induced a transient elevation of [Ca2+]i in a Ca(2+)-free medium followed by a secondary [Ca2+]i rise upon Ca2+ readmission due to store-operated calcium entry (SOCE). In voltage-clamped cells, agonists activated two kinetically distinct currents, which showed differing voltage dependences and were identified as Ca(2+)-activated (I(Cl(Ca))) and volume-regulated (I(Cl, swell)) chloride currents. NPPB and DIDS more efficiently inhibited I(Cl(Ca)) and I(Cl, swell), respectively. Cell swelling caused by hypotonic solution invariably activated I(Cl, swell) while regulatory volume decrease occurred in intact cells, as was found in flow cytometry experiments. The PLC inhibitor U-73122 blocked both agonist- and cell swelling-induced I(Cl, swell), while its inactive analogue U-73343 had no effect. I(Cl(Ca)) could be activated by cytoplasmic calcium increase due to thapsigargin (TG)-induced SOCE as well as by buffering [Ca2+]i in the pipette solution at 500 nM. In contrast, I(Cl, swell) could be directly activated by 1-oleoyl-2-acetyl-sn-glycerol (OAG), a cell-permeable DAG analogue, but neither by InsP3 infusion nor by the cytoplasmic calcium increase. PKC also had no role in its regulation. Agonists, OAG, and cell swelling induced I(Cl, swell) in a nonadditive manner, suggesting their convergence on a common pathway. I(Cl, swell) and I(Cl(Ca)) showed only a limited overlap (i.e., simultaneous activation), although various maneuvers were able to induce these currents sequentially in the same cell. TG-induced SOCE strongly potentiated I(Cl(Ca)), but abolished I(Cl, swell), thereby providing a clue for this paradox. Thus, we have established for the first time using a keratinocyte model that I(Cl, swell) can be physiologically activated under isotonic conditions by receptors coupled to the phosphoinositide pathway. These results also suggest a novel function for SOCE, which can operate as a "selection" switch between closely localized channels.


Figures
F<sc>igure</sc> 1.
Figure 1.
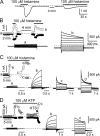
Histamine, ATP, and cell swelling activate two different currents in HaCaT cells. (A) Histamine-induced membrane current responses in a HaCaT cell measured at the holding potential of −60 mV. Ca2+ concentration in the pipette solution in this experiment, as well as those illustrated in B–D, was buffered at 100 nM. In this and all subsequent figures, drug administration period and zero current level are indicated by solid and dotted horizontal lines, respectively. (B) Histamine application evoked current that, upon a voltage step, showed rapid activation and characteristic inactivation at potentials positive to 40 mV. Current amplitude is shown at two different potentials. In this and all subsequent figures, open squares denote current amplitude at 100 mV and closed circles at −100 mV. Current amplitude was monitored by applying voltage ramps from −100 to 100 mV from a holding potential of −40 mV. Superimposed current traces measured by voltage step protocol during the gaps labeled a and b are shown below. (C) In a different cell, using similar voltage step protocol, 100 μM histamine initially evoked current, which was distinct from that illustrated in B. It was characterized by slow activation during depolarizing voltage steps, complete absence of inactivation even at strong depolarization, and by a much smaller inward component (traces labeled b measured during the respective gap in the time course plot). However, in the continuous presence of histamine, this current disappeared, or at least it was greatly diminished, while current response similar to that shown in B appeared (traces labeled c and d). (D) Two distinct Cl currents were differentially activated by ATP and cell swelling in the same HaCaT cell. ATP application evoked a transient current that developed within 2.5 min and nearly completely decayed in ∼10 min in the continuous presence of ATP. Reducing tonicity of the external solution from 320 to 200 mosmol/l evoked a large sustained current. Superimposed current traces were evoked by voltage steps from −40 mV to different levels ranging from −120 to 100 mV during the periods indicated by the corresponding letters in the time course plot. HTS-induced current was stable during the next 30 min of recording (not depicted).
F<sc>igure</sc> 2.
Figure 2.
Ion nature of currents in HaCaT cells. (A) Slow outwardly rectifying current that was persistently activated by [Ca2+]i elevated to 500 nM (clamped using 10 mM BAPTA) and recorded in external solutions of different ion composition as indicated. Left, superimposed current traces; right, corresponding I–V relationships. Current amplitudes were measured at the end of the test voltage step. (B) Tail current analysis of the current in the same cell. Left, an example of current traces and the voltage protocol used to measure tail currents. Tail current amplitude was obtained by exponential approximation of the tail current to the onset of the negative voltage step. Right, amplitude of the tail current plotted vs. test potential under the same ion conditions as in A and shown by the corresponding symbols. (C) 100 μM histamine applications evoked current with properties characteristic of ICl, swell. Replacing the external solution of 140 mM Cs+ with 140 mM Na+ had no effect on this current (not depicted), whereas reducing external Cl concentration from 145 to 25 mM markedly reduced the amplitude of the outward current and shifted the reversal potential of the current positively. Superimposed current traces measured by applying voltage steps from −40 mV to test potentials ranging from −120 to 100 mV under different ion conditions are shown on the left. Right panel shows I–V relationships measured as shown by the corresponding symbols for ion conditions indicated at the top. In this experiment, [Ca2+]i was clamped at 100 nM. (D) Summary of the reversal potential measurements in 14 cells displaying ICl, swell and 13 cells displaying ICl(Ca) under variable electrochemical gradients for chloride ions. Note that in four cells clamped using pipette solution with 500 nM Ca2+ (data points inside the dotted box) EREV was 11–14 mV more positive compared with ECl, which could indicate the presence of Ca2+-dependent cationic channels in some HaCaT cells. The dotted line is drawn for complete correspondence of ECl and EREV. The solid line shows linear regression analysis of the data points excluding those inside the box.
F<sc>igure</sc> 3.
Figure 3.
ICl(Ca) is persistently active at [Ca2+]i = 500 nM and facilitated by capacitative Ca2+ entry. (A) Sustained activation of ICl(Ca) under conditions of elevated intracellular Ca2+ concentration ([Ca2+]i was clamped at 500 nM). Shortly after breakthrough (3 min), ICl(Ca) activation was revealed by applying voltage step protocol (superimposed traces in the inset). The activation was persistent (compare two I–V relationships for the current amplitude at the end of the pulse measured at 3 and 34 min after the beginning of the experiment). The inset shows superimposed current traces measured in isotonic solution (top) and, in the same cell, ICl, swell traces recorded during HTS application (bottom). (B) Ca2+ imaging experiments revealed TG-induced SOCE in HaCaT cells. Each data point represents mean value of the [Ca2+]i signal in 120 cells. Note that the SEM values are shown for every 10th data point for clarity. (C) Superimposed current traces recorded in the same HaCaT cell with [Ca2+]i buffered at 100 nM in control (left), after treatment of the cell for 8 min with 1 μM thapsigargin, followed by the addition of 10 mM Ca2+ to the external solution (middle) and 10 min after reducing external Ca2+ to 0.5 mM (right).
F<sc>igure</sc> 4.
Figure 4.
Blocking action of NPPB and DIDS on Cl currents in HaCaT cells. (Aa) Superimposed current traces induced by the action of histamine (100 μM) measured before and after NPPB application. (A, b and c) I–V relationships of ICl, swell induced by 100 μM histamine application (b) or HTS of 200 mosmol/l (c) before and after 100 μM NPPB application (the latter are indicated by the arrows). (Ad) Mean histamine-induced ICl, swell amplitude was measured at 100 mV while DIDS at 100 μM was applied as shown by the horizontal bar (n = 4). These experiments were performed with [Ca2+]I = 100 nM. (Ba) Superimposed current traces of ICl(Ca) induced by high-Ca2+ pipette solution ([Ca2+]i = 500 nM) measured before and after 100 μM NPPB application. (B, b and c) ICl(Ca) amplitude was monitored by a ramp protocol while NPPB (b) or DIDS (c) was applied at 100 μM as shown by the horizontal bars (n = 4 for both drugs). Note that current amplitudes are steady from the beginning of measurements as high-Ca2+ pipette solution evokes a sustained ICl(Ca) (compare with Fig. 3 A).
F<sc>igure</sc> 5.
Figure 5.
PLC and OAG-dependent, PKC-independent activation of ICl, swell in HaCaT cells. (A) HTS-induced ICl, swell was strongly inhibited by 1 μM U-73122 application. Current–voltage relationships were measured by the voltage step protocol during the gaps (not depicted). (B) OAG (100 μM) application induced ICl, swell in HaCaT cells, which was not affected by the PKC inhibitor staurosporine (SP, 1 μM) or ATP application (100 μM). (C) ICl, swell current response to HTS (200 mosmol/l) during the application of phorbol-12-myristate-13-acetate (PMA, 100 nM, n = 10). Note that preceding PMA application had no noticeable effect on the membrane current. (D) InsP3 included in the pipette solution did not induce ICl, swell or prevent its occurrence in response to HTS (n = 5). Note, however, that the response to HTS during InsP3 infusion via the pipette was of a much smaller amplitude compared with controls (e.g., A–C and E, note different current scale). (E) HTS-induced (200 mosmol/l) ICl, swell was not affected by histamine (100 μM), ATP (100 μM), or OAG (100 μM) applications (n = 4). (F) Flow cytometry measurements showed cell volume decrease under isotonic conditions starting 30 s after 100 μM OAG application. Each column represents relative cell volume of 8,000 keratinocytes. OAG was applied at time zero. In the experiments illustrated in A–E, [Ca2+]i was buffered at 100 nM.
F<sc>igure</sc> 6.
Figure 6.
SOCE-dependent inhibition of ICl, swell. (A) Under control conditions (no thapsigargin treatment), the outward ICl, swell induced by HTS somewhat increased upon 10 mM external CaCl2 application (traces on the left). However, in a 1 μM thapsigargin-treated cell, HTS-induced ICl, swell was nearly abolished by external Ca2+ elevation to 10 mM (traces on the right). Note that there was some transient increase in the outward current, which preceded the inhibition, probably due to an increase in the external chloride concentration as seen in control cells as well. [Ca2+]i was buffered at 100 nM. (B) Superimposed current traces measured by applying voltage steps ranging from −120 to 100 mV with a 20-mV increment during the gaps denoted by the same letters in A. (C) Flow cytometry measurements showed cell RVD in response to HTS (applied at time zero) in control (light columns). However, 1 μM TG-treated keratinocytes (dark columns) remained swollen even 15 min after HTS application (133% of the initial volume). Each column represents relative cell volume of 8,000 keratinocytes.
F<sc>igure</sc> 7.
Figure 7.
SOCE as a switch mechanism favoring activation of either ICl, swell or ICl(Ca) due to their differential control. (A) Ca2+ imaging experiments showed SOCE activation by 100 μM histamine (top) or 100 μM ATP application (bottom) in HaCaT cells. Each data point represents mean value of the [Ca2+]i signal in 120 cells. Note that the SEM values are shown for every 10th data point. (B) Assuming differences in Ca2+ sensitivity or relative channel position, low magnitude SOCE favors ICl, swell (mode 1), while high magnitude SOCE, by inhibiting ICl, swell and potentiating ICl(Ca), favors ICl(Ca) (mode 2). At an intermediate magnitude SOCE, ICl, swell is already inhibited while ICl(Ca) is not yet fully activated, thus both currents are small (mode 3). (C) In a cell showing an initial ICl, swell response to 100 μM histamine (1), [Ca2+]out elevation from 0.5 to 10 mM resulted in a transition to ICl(Ca) mode (2) but after [Ca2+]out was returned to 0.5 mM, both currents were reduced (3) followed by an increase of ICl, swell (1), presumably due to the removal of the Ca2+-dependent inactivation of VRACs. Traces on the right were recorded in the same cell after its exposure to HTS. Note that ICl(Ca) and HTS-induced ICl, swell were plotted on a different current scale as they were larger in size. [Ca2+]i was buffered at 100 nM.
F<sc>igure</sc> 8.
Figure 8.
Agonists (A) activating PLC-coupled receptors (R), such as P2Y2 or H2 receptors, stimulate production of InsP3 and DAG. Initially DAG activates VRACs and the RVD phenomenon. Parallel InsP3 production induces calcium store depletion and SOCE. The latter elevates subplasmalemmal calcium concentration. When it is low, VRACs are preferentially activated (denoted as mode 1 in Fig. 7 B). However, when the calcium concentration in the microdomain becomes high enough, VRACs are inhibited in spite of the continuing DAG production, and Ca2+-dependent chloride channels are preferentially activated instead. TG, by inhibiting calcium uptake by SERCA proteins, evokes calcium store depletion via leak channels and thus induces SOCE. Therefore, it leads to the inhibition of VRACs and activation of ICl(Ca) as InsP3 does under physiological conditions. This scheme could explain how the two different chloride channels are regulated by calcium influx and why respective currents show only a limited degree of an overlap.

Similar articles

Cited by

References

    1. Abeele, F.V., Y. Shuba, M. Roudbaraki, L. Lemonnier, K. Vanoverberghe, P. Mariot, R. Skryma, and N. Prevarskaya. 2003. Store-operated Ca2+ channels in prostate cancer epithelial cells: function, regulation, and role in carcinogenesis. Cell Calcium. 33:357–373. - PubMed
    1. Arreola, J., J.E. Melvin, and T. Begenisich. 1995. Volume-activated chloride channels in rat parotid acinar cells. J. Physiol. 484:677–687. - PMC - PubMed
    1. Arreola, J., J.E. Melvin, and T. Begenisich. 1996. Activation of calcium-dependent chloride channels in rat parotid acinar cells. J. Gen. Physiol. 108:35–47. - PMC - PubMed
    1. Biro, T., I. Szabo, L. Kovacs, J. Hunyadi, and L. Csernoch. 1998. Distinct subpopulations in HaCaT cells as revealed by the characteristics of intracellular calcium release induced by phosphoinositide-coupled agonists. Arch. Dermatol. Res. 290:270–276. - PubMed
    1. Boese, S.H., R.K. Kinne, and F. Wehner. 1996. Single-channel properties of swelling-activated anion conductance in rat inner medullary collecting duct cells. Am. J. Physiol. 271:F1224–F1233. - PubMed

Publication types