. 2005 Jan 17;168(2):233-43.
doi: 10.1083/jcb.200411005.

Nuclear transport of single molecules: dwell times at the nuclear pore complex

Affiliations

Nuclear transport of single molecules: dwell times at the nuclear pore complex

Ulrich Kubitscheck et al. J Cell Biol. .

Abstract

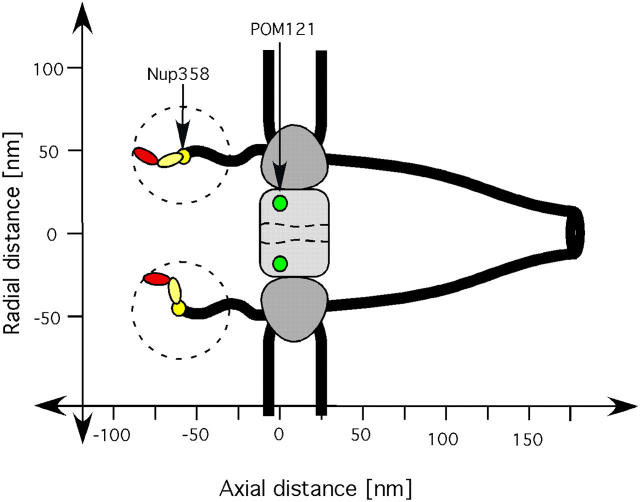
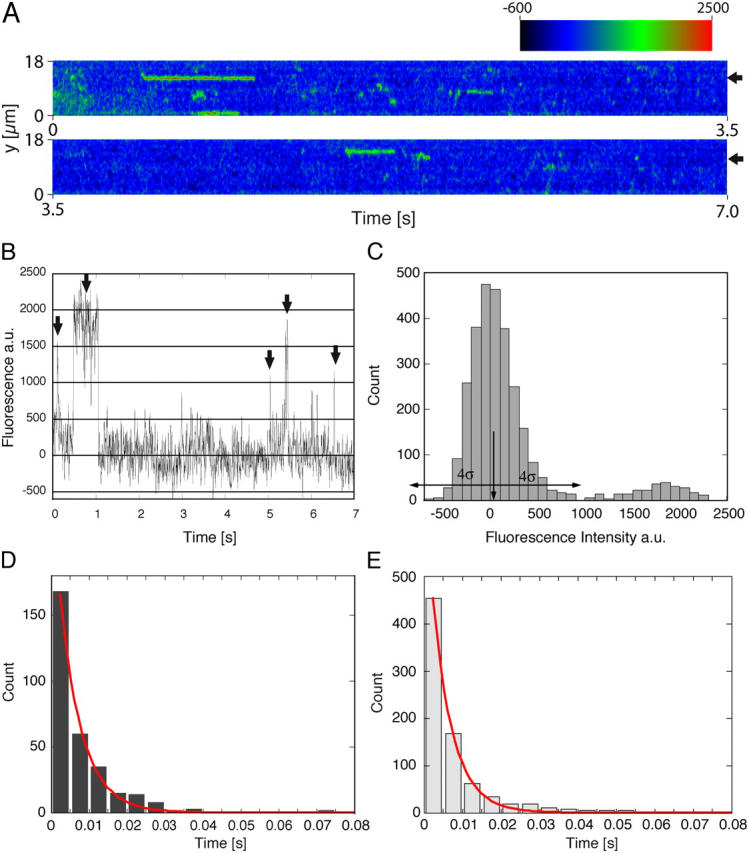
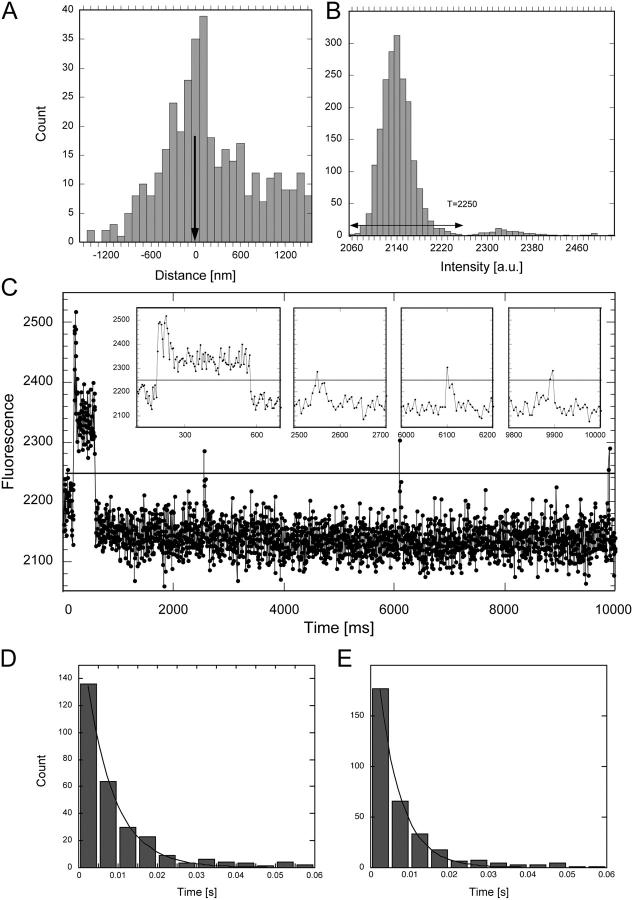
The mechanism by which macromolecules are selectively translocated through the nuclear pore complex (NPC) is still essentially unresolved. Single molecule methods can provide unique information on topographic properties and kinetic processes of asynchronous supramolecular assemblies with excellent spatial and time resolution. Here, single-molecule far-field fluorescence microscopy was applied to the NPC of permeabilized cells. The nucleoporin Nup358 could be localized at a distance of 70 nm from POM121-GFP along the NPC axis. Binding sites of NTF2, the transport receptor of RanGDP, were observed in cytoplasmic filaments and central framework, but not nucleoplasmic filaments of the NPC. The dwell times of NTF2 and transportin 1 at their NPC binding sites were 5.8 +/- 0.2 and 7.1 +/- 0.2 ms, respectively. Notably, the dwell times of these receptors were reduced upon binding to a specific transport substrate, suggesting that translocation is accelerated for loaded receptor molecules. Together with the known transport rates, our data suggest that nucleocytoplasmic transport occurs via multiple parallel pathways within single NPCs.


Figures

Figure 1.
Figure 1.
Topographic markers at the NPC. Sketch of the site of GFP-POM121 (green), the binding sites of the primary antibody αNup358 (yellow), and the Alexa633-labeled secondary antibody (red). The range of geometrical binding configurations is indicated by the dashed circles, and spreads the experimentally observed label distribution by ±30 nm.
Figure 2.
Figure 2.
Labeling of the NE by GFP-POM121. (A) Bright-field image of the equatorial plane of HeLa cell nucleus. A line of green fluorescence originating from GFP-POM121 contained in the NPCs in focus marked the position of the NE. The image was smoothed using a 5 × 5 Gaussian kernel with a SD of 1 pixel and contrasted for display. Field size, 10.8 × 10.8 μm2. (B) Profile along a row of pixels (solid line in A), and fitting result on the basis of a Gaussian on a linear ramp in a region of ±5 pixels within the maximum (solid line, closed circles). The unsymmetrical shape of the profile was due to the GFP-POM121 within out-of-focus regions of the NE (left of the NE in A).
Figure 3.
Figure 3.
Observation of single antibodies at the NE. (A) Single frames of a video sequence showing the binding of secondary Alexa633-labeled antibodies (red spots) to preincubated αNup358 in the equatorial plane of a HeLa cell nucleus. An image of GFP-POM121 was acquired before movie acquisition and overlaid by the red channel image data. It was possible to visualize the binding of individual fluorescent antibodies to their NPC-bound epitopes one at a time. Images were smoothed using a 5 × 5 Gaussian kernel with a SD of 1 pixel and contrasted for display (integration time, 50 ms; frame rate, 6.67 Hz). Bar, 2 μm. (B) Plot of all antibody positions determined in the complete video sequence (400 images). The solid line shows the positions of the GFP-POM121 indicating the NE (c, cytoplasm; n, nucleoplasm). (C) Frequency histogram of the αNup358 binding sites in relation to the respective nearest point of the NE (defined as zero). The histogram has a distinct maximum at d = −72 ± 10 nm (left arrow). The data clearly demonstrate that Nup358 is located at the tips of the cytoplasmic filaments.
Figure 4.
Figure 4.
Individual NTF2-Alexa488 molecules observed at the NE. (A) The equatorial plane of a HeLa cell nucleus was imaged and bleached in the green channel in the presence of picomolar concentrations of NTF2-Alexa488. Complete bleaching of the dominant GFP fluorescence was achieved within 1 s of continuous illumination with 2 kW/cm2 of 488-nm laser light. Only then, the single, much fainter fluorescent NTF2 molecules became visible. The shown frames are video stills taken with a frame integration time of 50 ms at the indicated time points (see Video 1, available at http://www.jcb.org/cgi/content/full/jcb.200411005/DC1). All frames were contrasted to fluorescence minimum and maximum within each frame; absolute intensities were 2927, 633, 311, 212, 120, and 86, respectively. Bar, 2 μm. (B) Position of the GFP-POM121 (solid line) and all NTF2 molecules observed in the image sequence (dots). Numerous molecules bind at identical, putative NPC positions. (C) NTF2-Alexa488 binding site distribution in relation to GFP-POM121. The long frame integration time prevented frequent observations of single NTF2-Alexa488 molecules in the nuclear interior.
Figure 5.
Figure 5.
Binding duration of NTF2 at the NPC. The original video data is shown in Video 2 (available at http://www.jcb.org/cgi/content/full/jcb.200411005/DC1). (A) The line of fluorescence intensities along the NE—averaged over three adjacent pixels—was plotted as a function of time. The bright lines in the image indicate the transient binding of single NTF2 molecules to the NE. (B) Fluorescence intensity along one row in A as a function of time (A, arrows on the right-hand side). The arrows indicate binding events at this NE position. (C) Frequency distribution of the fluorescence intensities of the time trace. The distribution showed two distinct maxima corresponding to the unbound state, when no NTF2-Alexa633 was present at the selected NE site, and bound states. The unbound state corresponded to the background signal distribution and was fitted by a Gaussian. A threshold was defined by the mean value plus 4 × SD. All intensity values above this threshold were interpreted as binding events (B, arrows). (D) Evaluation of such time traces yielded the dwell time histogram of NTF2 binding. The histogram data were fitted by an exponential describing the dissociation of bound NTF2-Alexa633 molecules from the NPC yielding a time constant of τNTF2 = 5.8 ± 0.2 ms. (E) Histogram of the binding times from experiments using NTF2-Alexa633 complexed with RanGDP. The corresponding fit yielded τNTF2–RanGDP = 5.2 ± 0.2 ms.
Figure 6.
Figure 6.
Binding of transportin-Alexa633 to the NE. (A) Binding site distribution of transportin in relation to GFP-POM121 from a single experiment. The mean of all positions determined between −300 and +300 nm was −2 nm (arrow). (B) Frequency distribution of the fluorescence intensities of the time trace shown in C. The distribution showed three distinct maxima corresponding to the unbound and bound states. The threshold was defined as described in the legend to Fig. 5. (C) Fluorescence intensity at one site on the NE plotted as a function of time. Binding events at this NE position are indicated by a fluorescence value above the threshold (horizontal line at 2250). (insets) Four binding events are shown at higher time resolution. The first inset shows a transportin molecule, which was probably labeled by two dye molecules as indicated by the successive bleaching yielding two distinct fluorescence levels of the bound state (B). The binding events were evaluated with regard to their duration, thus yielding the dwell time histogram of transportin-Alexa633 (D). The histogram data were fitted by an exponential yielding a time constant of τtransportin = 7.1 ± 0.2 ms. (E) Histogram of the dwell times from experiments using transportin-Alexa633 complexed with M3-GST yielding τtransportin&M3-GST = 5.6 ± 0.2 ms.

Similar articles

Cited by

References

    1. Adam, S.A., R.S. Marr, and L. Gerace. 1990. Nuclear protein import in permeabilized mammalian cells requires soluble cytoplasmic factors. J. Cell Biol. 111:807–816. - PMC - PubMed
    1. Babcock, H.P., C. Chen, and X. Zhuang. 2004. Using single-particle tracking to study nuclear trafficking of viral genes. Biophys. J. 87:2749–2758. - PMC - PubMed
    1. Bayliss, R., R.K. Ribbeck, D. Akin, H.M. Kent, C.M. Feldherr, D. Görlich, and M. Stewart. 1999. Interaction between NTF2 and xFxFG-containing nucleoporins is required to mediate nuclear import of RanGDP. J. Mol. Biol. 293:579–593. - PubMed
    1. Bodoor, K., S. Shaikh, D. Salina, W.H. Raharjo, R. Bastos, M. Lohka, and B. Burke. 1999. Sequential recruitment of NPC proteins to the nuclear periphery at the end of mitosis. J. Cell Sci. 112:2253–2264. - PubMed
    1. Bonifaci, N., J. Moroianu, A. Radu, and G. Blobel. 1997. Karyopherin β2 mediates nuclear import of a mRNA binding protein. Proc. Natl. Acad. Sci. USA. 94:5055–5060. - PMC - PubMed

Publication types

MeSH terms

Substances