. 2005 Jan 17;168(2):257-69.
doi: 10.1083/jcb.200408145.

Role of mitochondria in the pheromone- and amiodarone-induced programmed death of yeast

Affiliations

Role of mitochondria in the pheromone- and amiodarone-induced programmed death of yeast

Andrei I Pozniakovsky et al. J Cell Biol. .

Abstract

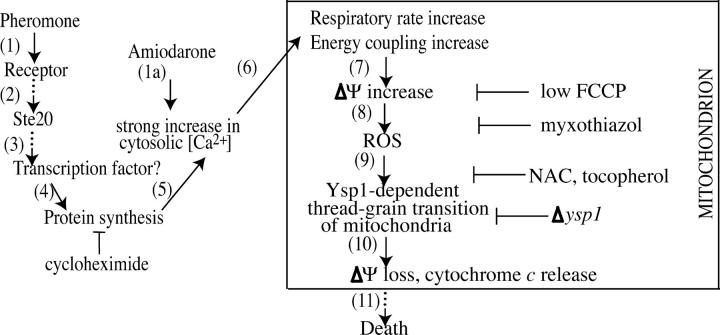
Although programmed cell death (PCD) is extensively studied in multicellular organisms, in recent years it has been shown that a unicellular organism, yeast Saccharomyces cerevisiae, also possesses death program(s). In particular, we have found that a high doses of yeast pheromone is a natural stimulus inducing PCD. Here, we show that the death cascades triggered by pheromone and by a drug amiodarone are very similar. We focused on the role of mitochondria during the pheromone/amiodarone-induced PCD. For the first time, a functional chain of the mitochondria-related events required for a particular case of yeast PCD has been revealed: an enhancement of mitochondrial respiration and of its energy coupling, a strong increase of mitochondrial membrane potential, both events triggered by the rise of cytoplasmic [Ca2+], a burst in generation of reactive oxygen species in center o of the respiratory chain complex III, mitochondrial thread-grain transition, and cytochrome c release from mitochondria. A novel mitochondrial protein required for thread-grain transition is identified.


Figures

Figure 1.
Figure 1.
Pheromone- and amiodarone-induced cell death of yeast share common features, including apoptotic markers. (A) Amiodarone treatment decreases the percentage of colony-forming cells. (B) 0.1 mg/ml α-factor was added. (C) 80 μM amiodarone was added to all of the samples. Other additions were as follows: 2 μM myxothiazol (myxo); 3 mM sodium nitroprusside (SNP); 1 mM carbonyl phenyl-tetramethylimidazole oxide (C-PTIO); 30 mM NAC; 20 μM α-tocopherol (toco). Cell survival in amiodarone experiments was determined by plating and in pheromone experiments by counting Methylene blue-positive cells. Error bars represent SD of three independent experiments. (D) Cytochrome c is released from mitochondria after 30 min of amiodarone treatment. Fragmentation of mitochondrial filaments in control is an artifact of formaldehyde fixation. (E and F) DNA is fragmented as shown by TUNEL and DNA cleavage, respectively. (G) Amiodarone, similar to Ca2+ ionophore A23187, triggers a cytosolic Ca2+ rise inside the cells. The effect of 80 μM amiodarone (amio) is relatively stronger as shown by the representative images and the percentages of Fluo-3/AM–positive cells. The effect of amiodarone is not abolished by EGTA and, hence, does not depend critically on the external Ca2+. Bars, 10 μm.
Figure 2.
Figure 2.
Effect of amiodarone on respiration of S. cerevisiae cells or mitochondria. Additions were as follows: (A and B) yeast, 0.6 × 10⁷ cells/ml; 10 μg/ml oligomycin (oligo); 1 μM FCCP; amiodarone (amio); 7 μM myxothiazol (myxo). (C) Yeast mitochondria (0.1 mg of protein/ml; mito); 150 μM ADP; 1 μg/ml oligomycin (oligo); 0.5 μM FCCP; 5 μM amiodarone. Numbers near the curves: nM O2/min × 10−7 cells (A) or nM O2/min × mg protein (C).
Figure 3.
Figure 3.
The pheromone- and amiodarone-induced increase in mitochondrial membrane potential in the yeast cells is Ca 2+ mediated. Mitotracker orange was used for the ΔΨ-dependent staining of mitochondria. (A) 0.1 mg/ml of the pheromone (α-factor). (B) Numbers below panels show amiodarone concentrations (μM). (C and D) Ca2+ ionophore A23187 triggers ΔΨ increase, ROS accumulation (C), and cell death (D). Error bars represent SD of three independent experiments. Bars, 10 μm.
Figure 4.
Figure 4.
The time courses of amiodarone- and pheromone-induced increases in ΔΨ and ROS. (A) ΔΨ and ROS after the addition of 80 μM amiodarone. (B) ROS increase induced by 0.1 mg/ml α-factor. The H2DCF-DA (50 μM) staining was used as a probe for ROS. Bar, 10 μM.
Figure 5.
Figure 5.
Effects of a protonophorous uncoupler of oxidative phosphorylation FCCP on the amiodarone-induced ΔΨ (Mitotracker orange) and ROS (H2DCF-DA) increases. Mitotracker orange and H2DCF-DA were revealed by microscopy (A) and FACS (B). 80 μM amiodarone was added to all samples at time zero. Bar, 10 μm.
Figure 6.
Figure 6.
The cellular effects of amiodarone are mediated by mitochondria. (A) Effects of the Q-cycle inhibitors myxothiazol (2 μM) and antimycin A (10 μM) on the amiodarone-induced increase in ΔΨ and ROS (Mitotracker orange and H2DCF-DA, respectively). (B) Colocalization of the Mitotracker orange and H2DCF-DA staining inside the yeast cell (numbered 1–3). 80 μM amiodarone was always present. Bar, 10 μm.
Figure 7.
Figure 7.
Ysp1localization and function. (A) Colocalization of the Mitotracker orange and Ysp1-GFP inside the yeast cell. Bar, 5 μm. In the top part of the figure, a domain structure of Ysp1 is shown; it contains predicted pleckstrin homology (PH) domain and two predicted transmembrane domains (on the scheme, in black). (B) Ysp1 is required for the thread-grain transition of mitochondrial filaments at a late stage of the amiodarone-induced suicide cascade. To image the mitochondrial network in the individual cells, 20 optical slices per field of view with 1.5-μm increments were collected and the resulting Z-stack was collapsed into a single image. Bar, 10 μm. (C) Ysp1 deletion prevents the amiodarone-triggered mitochondria de-energization. Cells with a dim diffuse Mitotracker orange staining (arrows) are present in the control strain but not in the mutant. Bar, 10 μm.
Figure 8.
Figure 8.
Proposed scheme of the programmed death cascade initiated by the pheromone and amiodarone. See the text for explanations.
Figure 9.
Figure 9.
Q-cycle in the inner mitochondrial membrane of S. cerevisiae. (1) Reduction of CoQ by two electrons coming from a noncoupled NADH-CoQ reductase and heme b H, followed by consumption of 2H+ from mitochondrial matrix. This occurs near the inner surface of the inner mitochondrial membrane (center i). (2) Diffusion of CoQH2 from center i to center o localized near the outer membrane surface. (3) One-electron oxidation of CoQH2 by the nonheme FeS cluster of Complex III (FeSIII). Here, reduced FeSIII and anion-radical CoQ are formed. 2H+ are released to the intermembrane space. (3a) FeSIII is oxidized resulting in an electron transfer to O2 via cytochromes c 1, c, and cytochrome oxidase, which forms H2O. (4) CoQ oxidation by heme b L. (4a) Alternatively, CoQ can be oxidized by O2 in a O2 -generating fashion. (5) Transmembrane electron transfer from b L to b H. (6) The CoQ diffusion back to center i. Operation of Q-cycle results in generation of ΔΨ and ΔpH (matrix being negatively charged and alkalinized). ΔΨ inhibits the b Lb H electron transfer and, hence, stimulates alternative CoQ oxidation by O2 and generation of O2 . Uncoupler discharges ΔΨ by passive H+ influx from the intermembrane space to matrix and, as a result, inhibits the ROS generation. Myxothiazol (myxo) also suppresses ROS generation by preventing CoQH2 oxidation to CoQ in center o. As for antimycin A (anti), it stimulates ROS production by inhibiting oxidation of b H and, as a consequence, of b L.

References

    1. Ameisen, J.C. 1996. The origin of programmed cell death. Science. 272:1278–1279. - PubMed
    1. Banki, K., E. Hutter, N.J. Gonchoroff, and A. Perl. 1999. Elevation of mitochondrial transmembrane potential and reactive oxygen intermediate levels are early events and occur independently from activation of caspases in Fas signaling. J. Immunol. 162:1466–1479. - PMC - PubMed
    1. Bazhenova, E.N., Y.I. Deryabina, O. Eriksson, R.A. Zvyagilskaya, and N.E. Saris. 1998. Characterization of a high capacity calcium transport system in mitochondria of the yeast Endomyces magnusii. J. Biol. Chem. 273:4372–4377. - PubMed
    1. Blanchard, F., M.E. Rusiniak, K. Sharma, X. Sun, I. Todorov, M.M. Castellano, C. Gutierrez, H. Baumann, and W.C. Burhans. 2002. Targeted destruction of DNA replication protein Cdc6 by cell death pathways in mammals and yeast. Mol. Biol. Cell. 13:1536–1549. - PMC - PubMed
    1. Breitenbach, M., F. Madeo, P. Laun, G. Heeren, S. Jarolim, K.-U. Fröhlich, S. Wissing, and A. Pichova. 2003. Yeast as a model for ageing and apoptosis research. Topics in Current Genetics. Vol. 3. Model Systems in Ageing. T. Nystrom and H.D. Osiewacz, editors. Springer-Verlag, Berlin/Heidelberg. 61–97.

Publication types

MeSH terms